

You read the headline: the company beat profit and sales estimates. Then you check the share price and it is down. It feels wrong, but it happens often. In the first week of November 2026 it happened to Palantir, while AMD and Arista Networks rose after their reports.
This guide shows a simple three-step check you can run yourself after any earnings report: look at Fair Value, then Financial Health, then ask WarrenAI for a bull case and a bear case. We use InvestingPro, the paid part of Investing.com, for the screens. It is general information about how to research, not advice on what to buy or sell, and none of the companies here is a recommendation.
A beat only tells you the results were better than analysts guessed. It does not tell you whether the price already assumed even better results.
Why a beat can still send a stock down
Three ideas explain most of these days.
- Beats are measured against a guess. Analysts publish an estimate before the report. “Beat” means the result was above that estimate. If the share price had already climbed because investors expected a big beat, a normal beat can disappoint.
- The future matters more than last quarter. The report is about the past three months. The price is about the next several years. Guidance, orders and growth rates for the next quarters often move the price more than the headline result.
- A high price needs high growth. When a stock trades at a high multiple of its earnings, the market is paying for years of strong growth. Any sign of slowing can cause a bigger drop than the same news would for a cheaper stock.
Three real examples from the same week
These numbers are from public sources. The price moves are close-to-close changes for the first full trading day after each report, worked out from Yahoo Finance’s price history.
| Company | Reported | Result against analysts | First trading day after | Why the market cared |
|---|---|---|---|---|
| Palantir (PLTR) | Mon 2 Nov 2026, after the close | Revenue USD 2.31 billion against USD 2.18 billion expected, adjusted EPS USD 0.44 against USD 0.41 | Tue 3 Nov: down 1.65% to USD 175.40, after falling as much as about 7% during the day | US commercial contract value grew 11% against 153% in the previous quarter, and backlog was flat from the quarter before |
| AMD (AMD) | Tue 3 Nov, after the close | Revenue USD 13.38 billion against USD 13.09 billion, adjusted EPS USD 2.09 against USD 1.95 | Wed 4 Nov: up 1.0% to USD 488.78, after being up about 6% earlier in the day | Data centre sales nearly doubled, and the next-quarter revenue forecast was above what analysts expected |
| Arista Networks (ANET) | Tue 3 Nov, after the close | Revenue USD 3.66 billion against USD 3.33 billion, adjusted EPS USD 1.20 against USD 1.08 | Wed 4 Nov: up 5.0% to USD 178.48 | The next-quarter forecast was above expectations and the company raised its full-year outlook |
Sources: CNBC on Palantir and Axios, CNBC on AMD and Yahoo Finance on AMD’s forecast, Arista’s results, MarketWatch on Arista and Investing.com’s Arista call summary, and Yahoo Finance price history for PLTR, AMD and ANET. Analyst estimates differ slightly between data providers.
Look at what these three have in common: all three beat. The difference is what was around the beat. AMD and Arista also gave forecasts above expectations. Palantir’s forward-looking numbers, its new contract value and backlog, slowed.
One more caution. A single day is a small sample. On Thu 5 Nov all three fell sharply: PLTR down about 9.7%, ANET down about 10.8% and AMD down about 17.3%. So the day-one move after a report tells you how the market felt on that day, not who was right.
What “expensive” means: forward P/E depends on the source
Palantir is a good example of how the same stock can look different. The forward P/E ratio is the share price divided by the earnings analysts expect over the next 12 months. A higher number means you pay more for each dollar of expected profit. After the report, published figures for Palantir’s forward P/E were far apart: about 81 on Hargreaves Lansdown’s research page (LSEG data) and about 114 in a Zacks note on 4 Nov. Providers use different earnings estimates and dates, so always note which source and which day a multiple comes from.
Step 1: check Fair Value
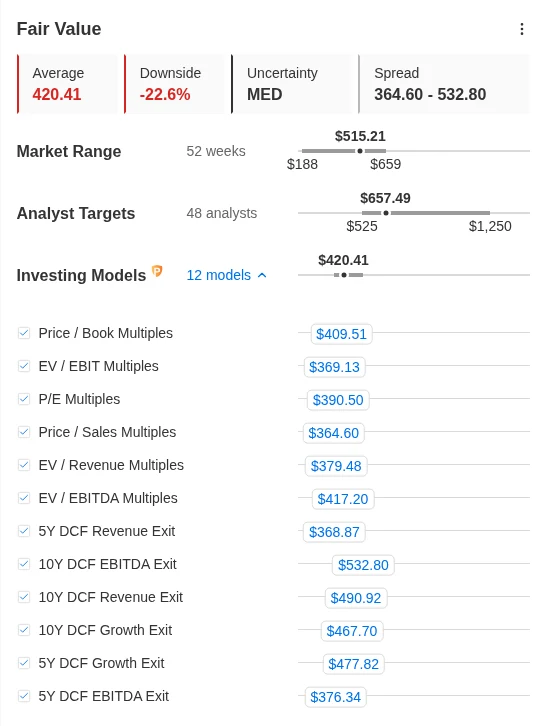
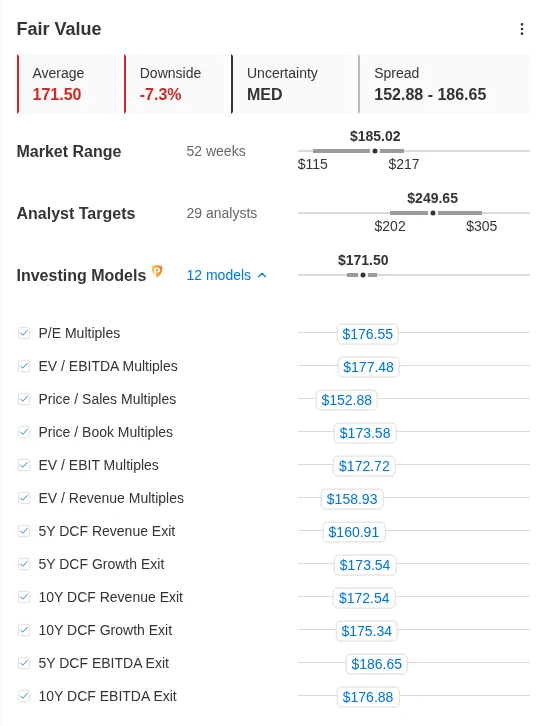
On an InvestingPro stock page, the Fair Value card shows four things: the average fair value from the models, the upside or downside against the current price, an uncertainty level (low, medium or high) and the spread between the lowest and highest model. Open the card to see each model, such as discounted cash flow and earnings-multiple models.
Read it in this order:
- Price against the average. Is the price above, near or below the average fair value?
- The spread. A wide spread means the models disagree, so treat the average with more caution.
- Uncertainty. A high level means the estimate rests on assumptions that can easily be wrong.
- The analyst target range. The card also shows analysts’ targets. Compare it with the model range and see whether both point the same way.
Fair Value is a model estimate, not a price target and not a forecast of where the share price goes next.
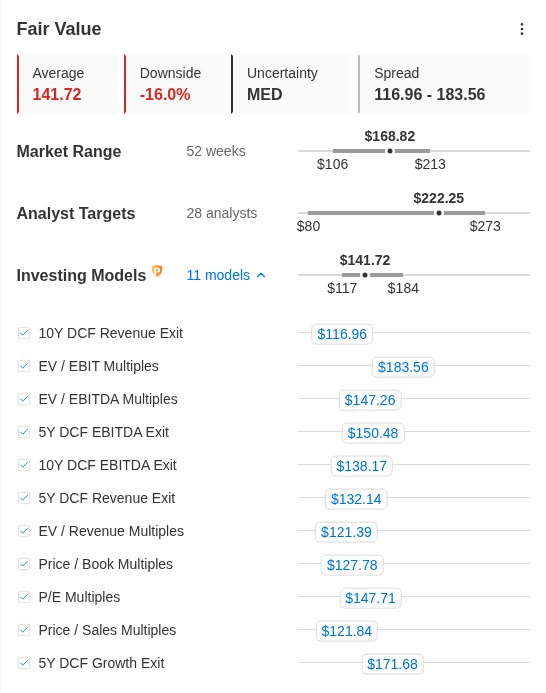
Here is the same card for the two stocks that rose on day one. The pattern to notice is that, on 11 Nov 2026, the model average was below the price for all three companies, while the analysts’ average target was above it. The two views do not always agree, and the card lets you see both.
Step 2: check Financial Health
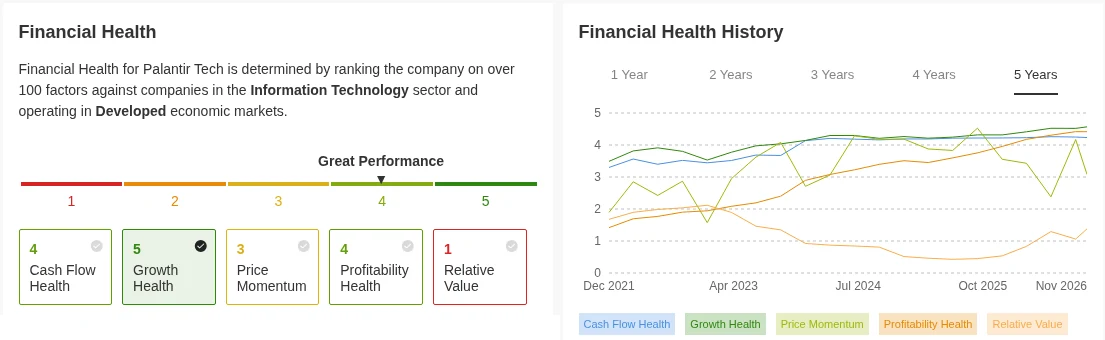
Fair Value asks “what might it be worth”. Financial Health asks “how strong is the business underneath”. InvestingPro ranks each company on over 100 factors against others in its sector and gives a score from 1 to 5. It also shows five sub-scores: Cash Flow Health, Growth Health, Price Momentum, Profitability Health and Relative Value.
After a report, the useful question is which sub-score looks weakest or has moved most. For a stock that fell after a beat, look at two in particular:
- Relative Value. A low score here means the stock looks expensive against its sector, which fits a “good news already priced in” story.
- Price Momentum. This shows how the price has been behaving, and tells you whether the stock had already run up before the report.
The Health tab also shows how each score has moved since 2021, so you can see whether a score fell recently or has always been low.
Step 3: ask WarrenAI for a bull case and a bear case
WarrenAI is the AI chat inside InvestingPro. Our WarrenAI guide covers the setup, credits and limits. For an earnings reaction, the most useful habit is to ask for both sides, so you do not only read the story you already believe.
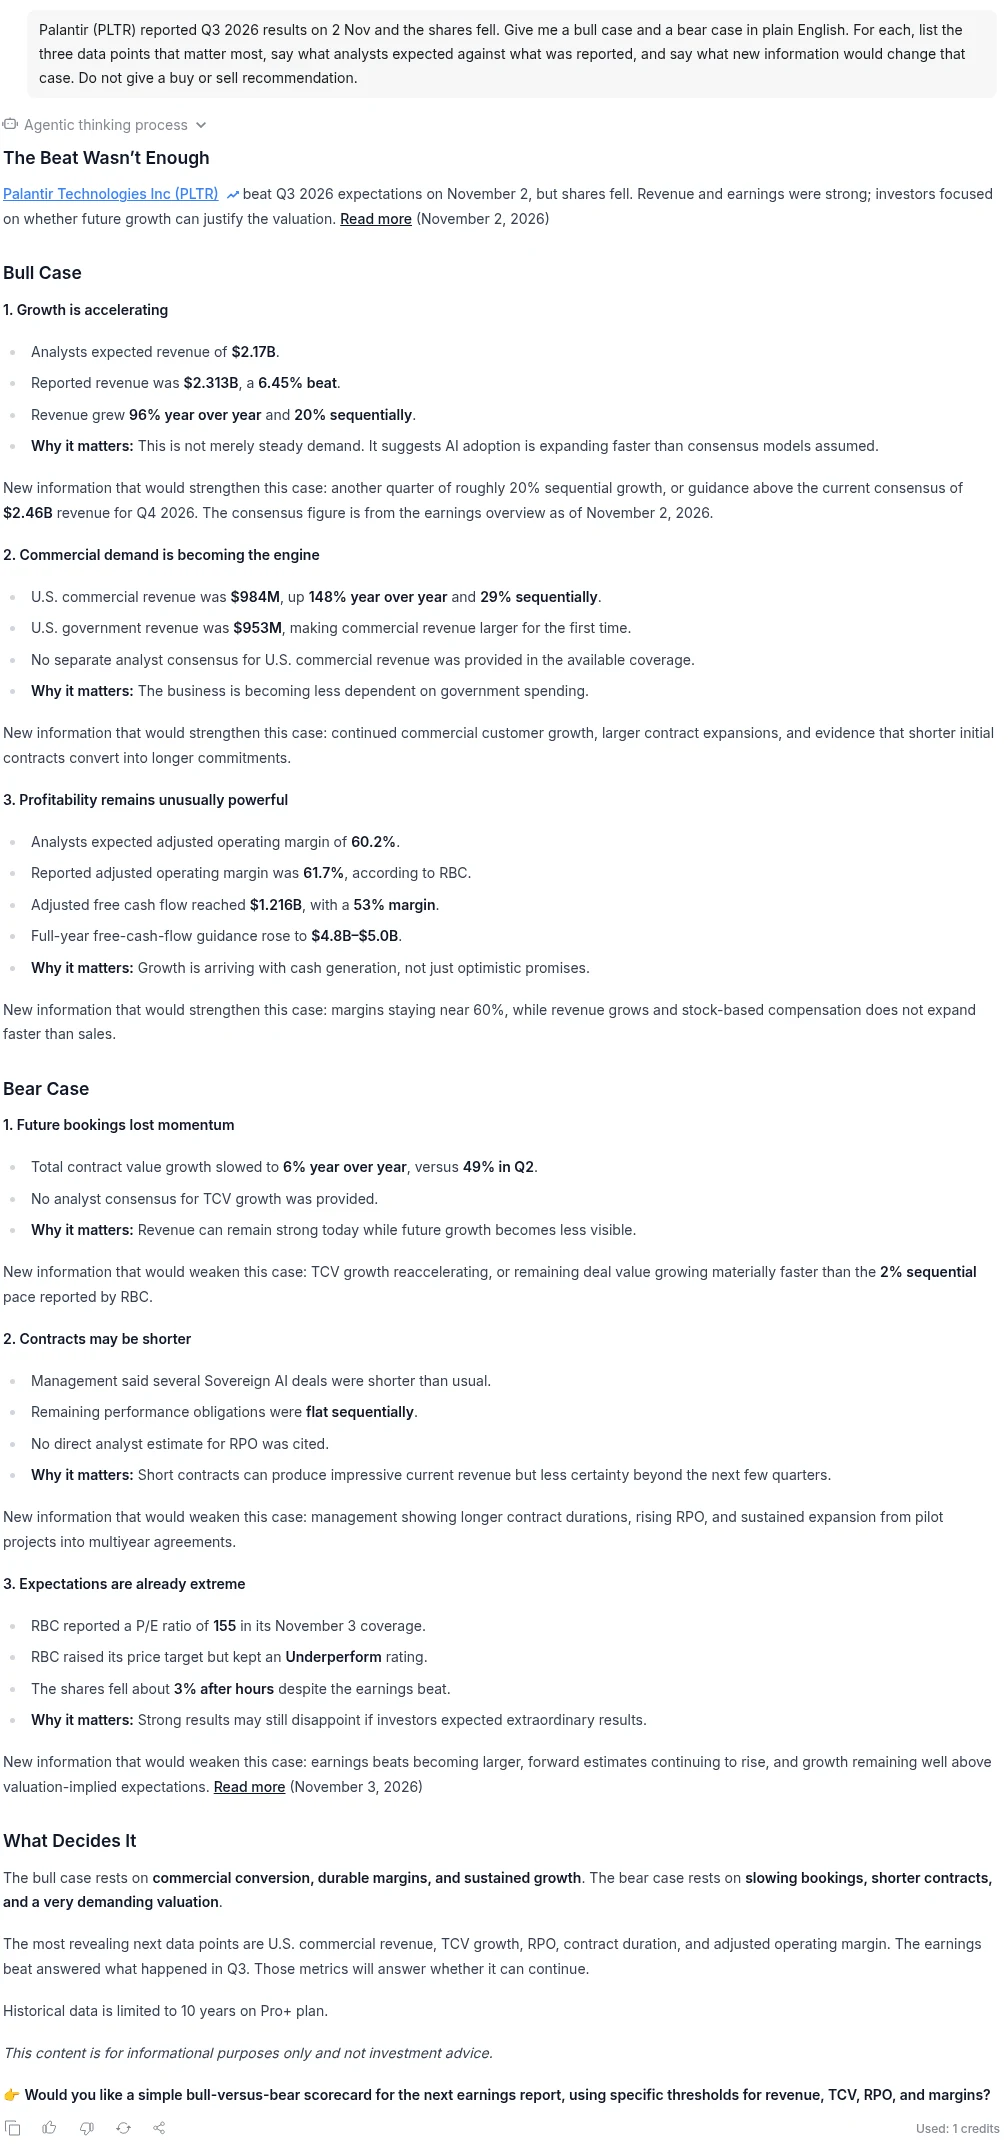
Here is a prompt you can copy and change. The example is Palantir:
“Palantir (PLTR) reported Q3 2026 results on 2 Nov and the shares fell. Give me a bull case and a bear case in plain English. For each, list the three data points that matter most, say what analysts expected against what was reported, and say what new information would change that case. Do not give a buy or sell recommendation.”
Tips that make the answer better:
- Name the company and the report date, so the answer is about this report and not an older one.
- Ask for numbers, such as growth rates and what analysts expected, and then check two or three of them yourself on the stock page.
- Add the stock’s chart as context with the plus button if you want price levels in the answer.
- Ask a follow-up such as “Which of these risks is already in the price, and how can I tell?”
WarrenAI warns that it may give incorrect information and is never financial advice. Treat the answer as a list of questions to check, not a verdict.
Here is what WarrenAI answered when we ran that prompt on 11 Nov 2026, in plain words. These are WarrenAI’s figures and its framing, not ours and not a recommendation.
- Its bull case, point 1: growth. Revenue was USD 2.313 billion against USD 2.17 billion expected, and it grew 96% from a year earlier.
- Its bull case, point 2: commercial demand. US commercial revenue was USD 984 million, ahead of US government revenue (USD 953 million) for the first time.
- Its bull case, point 3: profit margin. Adjusted operating margin was 61.7% against 60.2% expected, a figure it credits to RBC.
- Its bear case, point 1: future bookings. Total contract value growth slowed to 6% from 49% in the previous quarter.
- Its bear case, point 2: contract length. Remaining performance obligations, the value of signed work still to be delivered, were flat from the quarter before, and management said several deals were shorter than usual.
- Its bear case, point 3: expectations. It quoted RBC’s price to earnings (P/E) ratio of 155 and said the shares fell about 3% after hours despite the beat.
A few things to check yourself, which is the point of the exercise:
- Different providers, different numbers. WarrenAI used USD 2.17 billion for expected revenue, while our table uses USD 2.18 billion from CNBC. Estimates differ slightly between data providers.
- Different measures. WarrenAI’s 6% against 49% is for total contract value. Our table shows US commercial contract value (11% against 153%), which is a different measure. We could not confirm WarrenAI’s 6% and 49% in the public sources we used, so check the company’s own report before relying on them.
- The P/E of 155 is not labelled forward. It may be a trailing figure, so do not compare it with the forward P/E figures earlier in this guide.
Why 3% after hours and 1.65% are both true. They measure different moments. WarrenAI’s 3% is an after-hours move, quoted from an RBC note dated 3 Nov, so it describes trading outside normal hours around the report, before the Tue 3 Nov session. The table’s figure is the change from one regular-session close to the next: down 1.65% on Tue 3 Nov, after falling as much as about 7% during that session. The much larger fall of about 9.7% came two days later, on Thu 5 Nov. We did not find the original RBC note, so treat the 3% as approximate.
A five-question checklist after any earnings report
- What did analysts expect, and did the company beat by a lot or a little?
- Did the company raise, keep or lower its forecast for the next quarter or year?
- Did a forward-looking number, such as orders, backlog or bookings, speed up or slow down?
- Is the price above, near or below the Fair Value range, and how wide is that range?
- Does the Financial Health score, especially Relative Value, suggest good news was already priced in?
If you can answer these five questions, the price move after a report usually makes more sense, even when it is still not what you expected.
What this check cannot do
- It cannot predict the next move. Fair Value and Financial Health describe the past and the present. Prices after a report can reverse within days, as the example above showed.
- Models can be wrong. Fair Value depends on assumptions, and the sources can disagree, as the Palantir P/E figures did.
- It does not know you. Your goals, timeframe and other holdings are not in any of these screens. This is not advice, and the three companies above are examples only.
Want to run these checks yourself? Our InvestingPro review covers what each plan includes and what it costs. The Fair Value and Health screens need a paid plan, and InvestingPro has a sale on right now: see our InvestingPro Black Friday guide for every phase, the dates and the renewal price.
Up to 55% off
Up to 55% off in the Early Bird sale until 24 Nov, 8pm Dubai time
Plus an extra 15% with code SRH. The 55% is on the 2-year plan. Yearly plans are 50% off. Monthly billing is not discounted. Check the final price at checkout.
If you prefer a model-based list to research on your own, read how the ProPicks AI dividend strategy works, including what its returns do and do not tell you.
Frequently asked questions
Why do stocks fall after beating earnings?
Because “beat” is measured against an analyst estimate, and the price may already assume more. Forecasts, orders and growth for the next quarters often matter more than last quarter’s result, and expensive stocks have less room for disappointment.
Does a stock that falls after earnings always keep falling?
No. Palantir fell 1.65% on the first day after its November 2026 report and fell again two days later, while AMD and Arista rose on day one and then fell on day two. One day is a small sample, and prices can reverse quickly.
What is Fair Value on InvestingPro?
An average of several valuation models, shown with an upside against the current price, an uncertainty level and the spread between the lowest and highest model. It is a model estimate, not a price target.
What does the InvestingPro Financial Health score measure?
It ranks a company on over 100 factors against others in its sector, from 1 to 5, with five sub-scores: Cash Flow Health, Growth Health, Price Momentum, Profitability Health and Relative Value.
Can WarrenAI tell me whether to buy a stock after earnings?
No. WarrenAI says it may be wrong and is never financial advice. It is useful for asking for both sides of the story and for pulling data together, and you should check the numbers yourself.
Is this financial advice?
No. It is general information about how to research a stock. The companies named are examples from one week, not recommendations.
Prices at a glance
Prices from each official pricing page. Prices can differ by region and may exclude tax.
Research, not advice. This article explains how tools work. It is general information, not a recommendation to buy or sell any investment, and not personal advice. Investing puts your capital at risk and you can get back less than you put in. Prices and plans change, so check the official site before you pay.
Some links on this page are affiliate links. If you subscribe through them we may earn a commission, at no extra cost to you. We score every tool on the same published criteria, using facts from official pages and our own testing. How we make money. This page is general information, not personal investment advice.