









A stock screener is a search tool for the stock market. You tell it what kind of company you are looking for, for example “large companies that pay a dividend”, and it goes through thousands of stocks and shows only the ones that match. Finviz describes it simply: a screener searches through a large amount of stock data and returns a list of stocks that match one or more criteria, which are called filters.
This guide is for beginners. It explains how screeners work, what the most common filters mean, how to build a first screen step by step, and what the screeners we review offer for free and on paid plans. If you only want our ranked list, see Best stock screeners. This page is the “how it works” companion to that ranking.
You can learn screening for free, and a screener gives you a list to research, never a list to buy.
What a stock screener does
Every screener works in the same three steps:
- Pick a universe. This is the pool of stocks to search, for example all US listed stocks, or stocks on a certain exchange or in a certain country.
- Add filters. Each filter is a rule, such as “market cap over $10 billion” or “dividend yield over 2%”. A stock has to pass every filter to stay on the list.
- Read the results. You get a table of matching stocks. Most screeners let you switch the columns (valuation, performance, technicals and so on), sort by any column and open each company page.
Better screeners then let you save the screen, get an alert when a new stock starts to match, and export the list to a spreadsheet. These extras are usually where the paid plans come in.
The filters, in plain English
Screeners can have hundreds or even thousands of filters, but they fall into a few groups. The definitions below follow the Finviz screener help page, which is a good free reference.
Descriptive filters
- Exchange, index, country: where the stock is listed or where the company is based, and whether it is in an index such as the S&P 500.
- Sector and industry: what the company does. Sectors are broad groups (for example utilities or technology); industries split each sector into smaller groups.
- Market cap: the total value of all the company’s shares (share price times the number of shares). It is the usual way to measure company size.
Valuation filters
- P/E (price to earnings): the share price divided by earnings per share over the last twelve months. Finviz notes that the normal level is different in every sector, so P/E is best compared within a sector or industry.
- Forward P/E: the same idea, but using forecast earnings for the next year.
- PEG: forward P/E divided by expected earnings growth. It tries to take growth into account.
- P/S and P/B: price compared with sales per share and with book value per share. P/S is often used for companies that do not make a profit yet.
Growth and profitability filters
- EPS growth and sales growth: how fast earnings per share and revenue have grown, for example quarter over quarter or over five years.
- Margins: gross, operating and net margin show how much of each dollar of sales the company keeps at each stage.
- Return on equity (ROE), assets (ROA) and invested capital (ROIC): how much profit the company makes on the money it uses.
Financial strength filters
- Current ratio and quick ratio: whether the company can cover its short-term bills.
- Debt to equity: how much the company relies on borrowed money compared with shareholders’ money.
Dividend filters
- Dividend yield: the yearly dividend per share divided by the share price, as a percentage.
- Payout ratio: the share of earnings paid out as dividends.
Price, volume and technical filters
- Performance: how much the price moved over a period, such as a week, a month or a year.
- Moving averages and RSI: common chart signals. A moving average smooths the price over, say, 50 or 200 days. RSI compares recent up moves with down moves.
- Average and relative volume: how many shares trade on a normal day, and whether today is unusually busy.
If you mostly screen on price and chart signals, our best charting tools ranking compares the tools built for that.
Ownership and analyst filters
- Insider and institutional ownership: how much of the company is held by its own managers, or by funds and other institutions.
- Short float: the share of tradable shares that has been sold short.
- Analyst recommendation and price target: what analysts who follow the stock say. These are opinions, not facts, and they change often.
Build your first screen in five steps
Here is a simple practice screen on the free Finviz screener, which opens without an account, so anyone can follow along. The goal is to learn the tool, not to find something to buy.
- Open the screener and pick the Descriptive tab.
- Set Market Cap to “+Large (over $10bln)” so you only see big companies.
- Set Dividend Yield to “Over 2%”.
- Set Sector to “Utilities”.
- Look at the result count, then switch between the Overview, Valuation and Financial views to compare the same companies on different numbers.
When we ran this on 30 October 2026, it returned 34 stocks. That number changes every day as prices and dividends move.
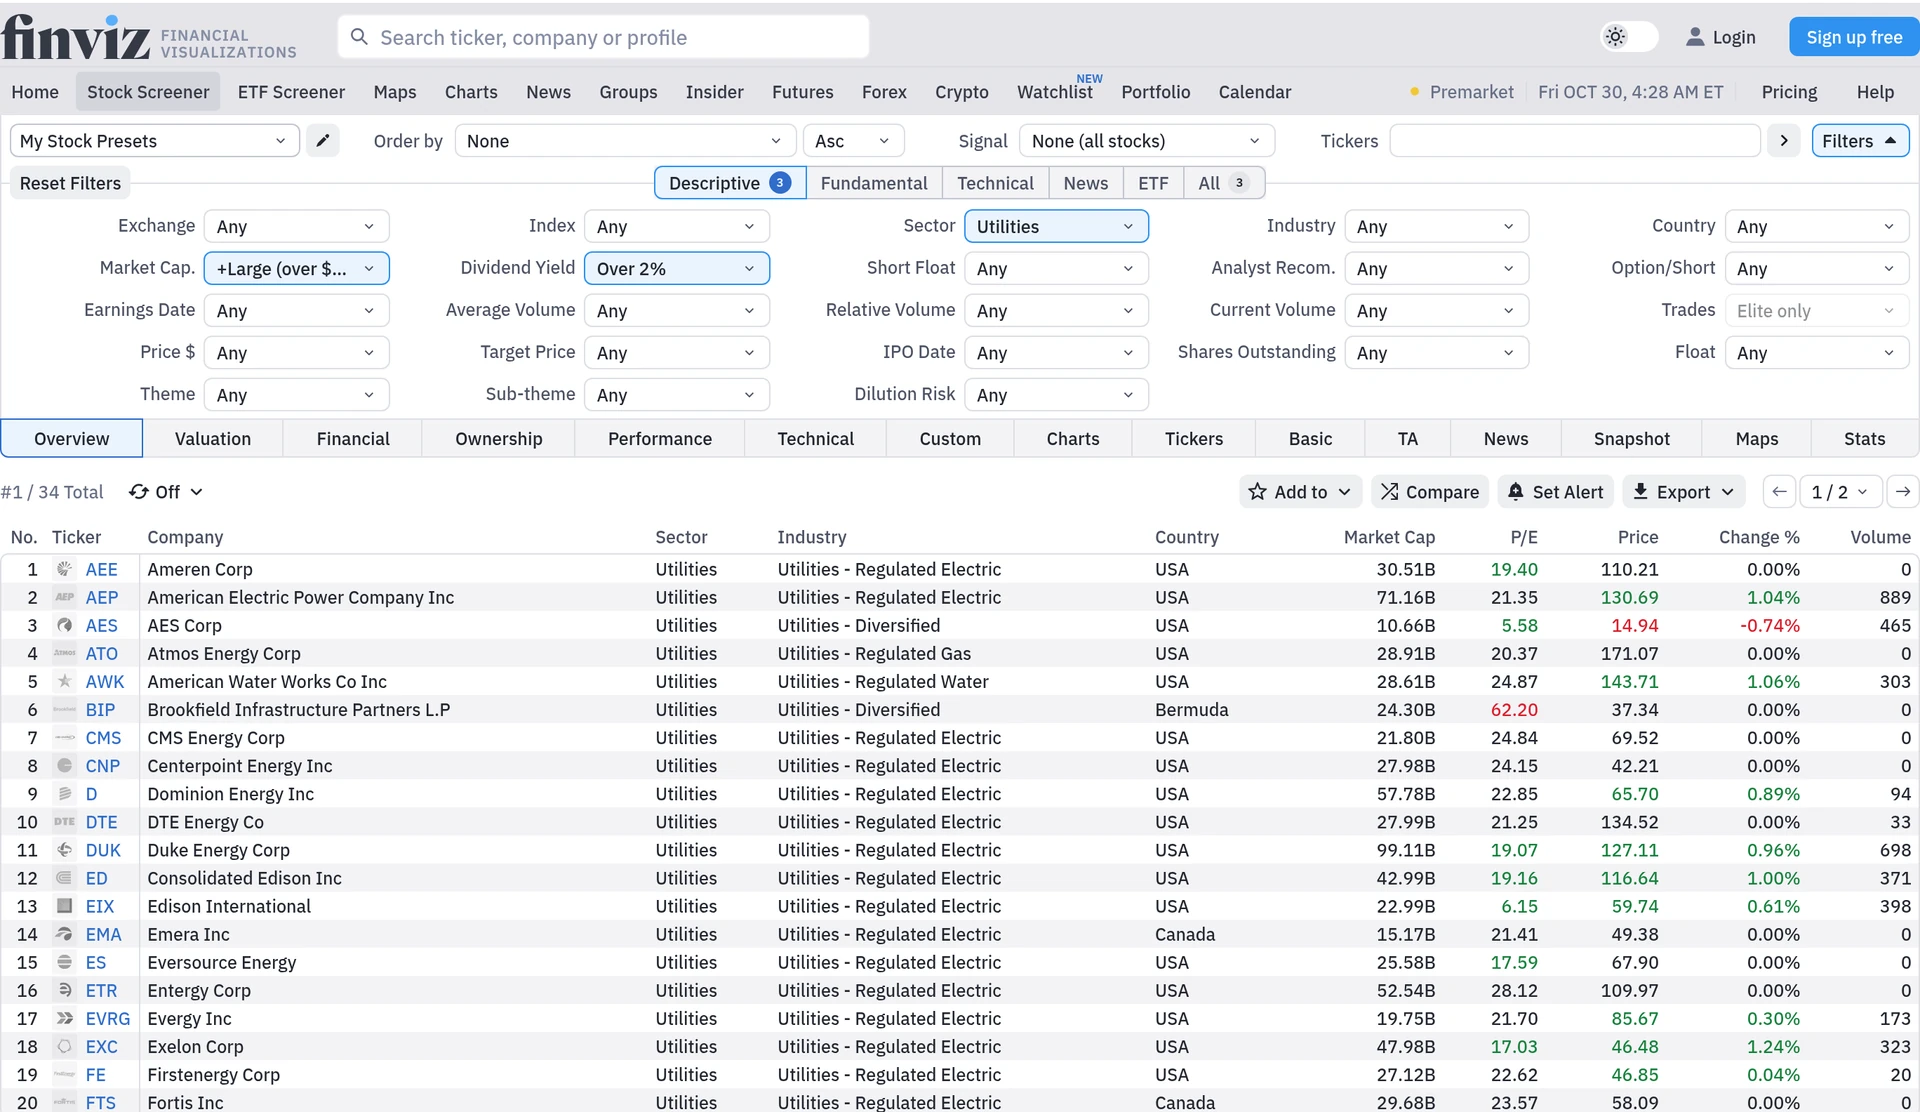
From here, a good habit is to change one filter at a time and watch what happens to the list. That teaches you what each filter really does much faster than reading definitions.
Common beginner mistakes
- Too many filters at once. Each filter removes stocks. Ten strict filters often leave zero results. Start with two or three and add more slowly.
- Comparing numbers across sectors. A “low” P/E for a bank and a “low” P/E for a software company mean different things. Compare within a sector.
- Forgetting that data can be delayed. Free plans often show delayed quotes. Finviz, for example, says its free quotes are delayed and that its paid Elite plan adds real-time data.
- Treating the list as the answer. A screener only checks numbers. It does not know about a lawsuit, a new product or a change of management. Use the list as the start of your research.
- Assuming every site uses the same data. Different providers calculate some numbers in slightly different ways, so the same filter can give a slightly different list on two sites.
Which screeners to try
These are the screeners from tools we review. The facts come from each tool’s official pages, checked again on 4 Nov 2026. This table is not a ranking. For our scored order, see Best stock screeners.
| Screener | Free way in | What stands out | Markets |
|---|---|---|---|
| Seeking Alpha | 7-day free trial for new Premium subscribers | Premium lets you build and save screens with about 100 criteria, including Seeking Alpha’s Quant Ratings and its grades for Value, Growth, Profitability, Momentum and EPS Revisions, plus ready-made screens | US-listed stocks and ETFs |
| InvestingPro | No free plan | Pro has 35 ready-made screens. Pro+ adds a customisable screener, 65+ ready-made screens and 1,200+ metrics | US and 70+ other markets |
| Morningstar | 7-day free trial, no free plan | Filter stocks, ETFs, mutual funds and closed-end funds with 200+ data points, sorted by Morningstar’s star, fair value and moat ratings. AI Quick Filters turn a request in plain words into filters | US-based securities, says Morningstar’s offer page |
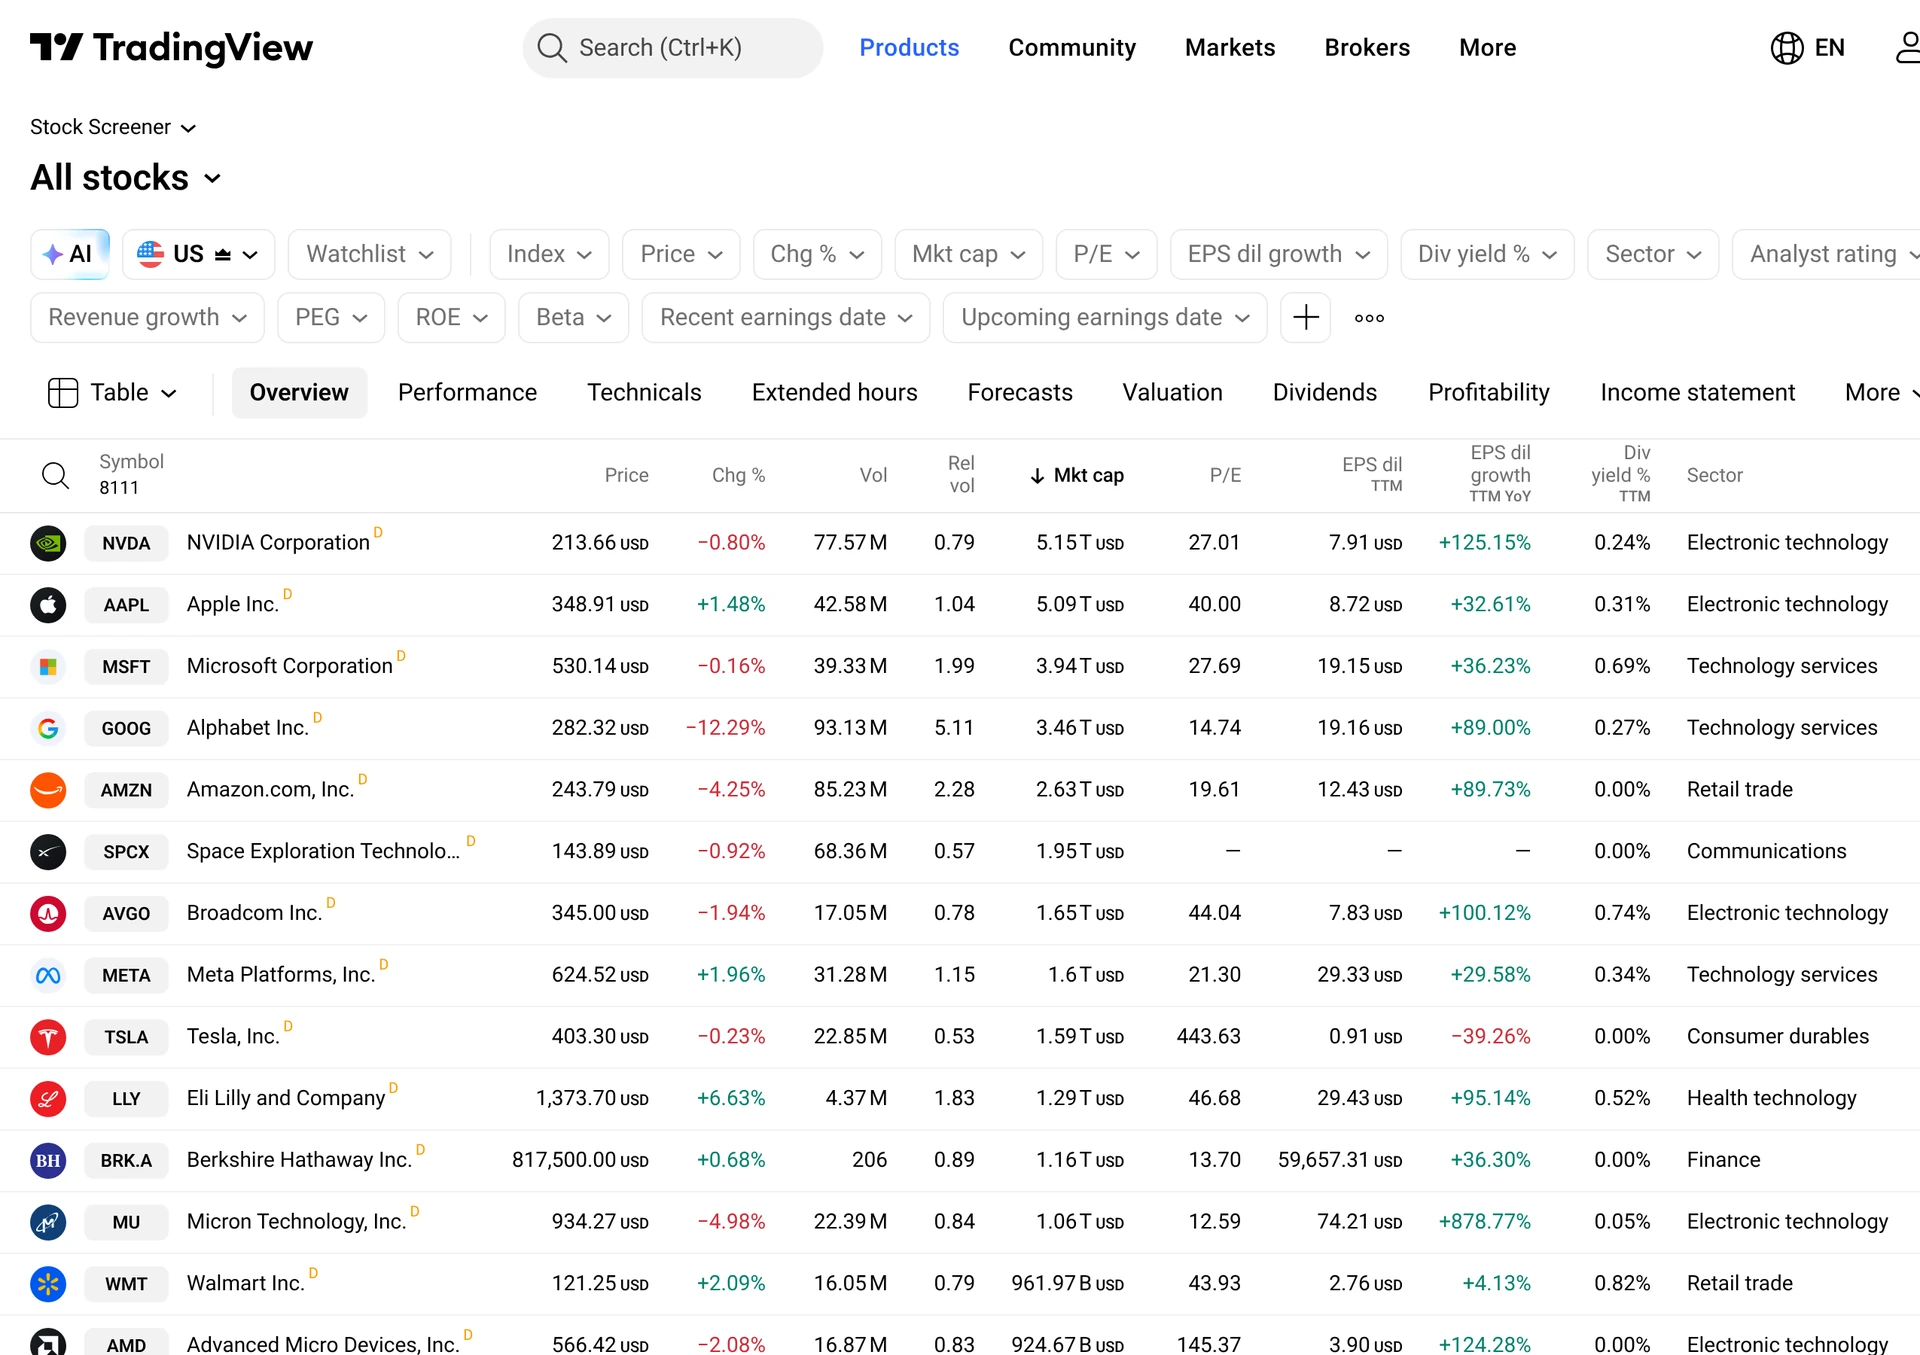
| TradingView | Screeners are included on the free Basic plan | Stock, ETF, crypto and DEX screeners with 500+ fundamental and technical fields, next to TradingView’s charts | 150+ exchanges in 50+ countries |
| Simply Wall St | Free plan; the screener shows the top 4 results | Visual style. Paid plans show every result and include saved screeners with alerts | 120,000+ stocks in 90+ markets, says Simply Wall St |
| Finviz | Free screener, no login needed to open it. 82 filters when we opened it, 5 of them for Elite only | Fast and simple. Elite adds real-time data, alerts when new stocks match a screen, and export | US exchanges (NASDAQ, NYSE, AMEX) |
| Stock Analysis | Free screener with 330 filters when we opened it, no account needed | Very low priced Pro plan. Saving screens needs Pro | Exchange country picker, including London, Xetra and Euronext |
| Koyfin | Free plan with 2 screens | 5,900+ filter criteria and CSV download, according to Koyfin’s screener page | 100,000+ global securities |
| Stock Rover | 14-day free trial of paid plans, no card needed | Screening with 300+ metrics on Premium. Higher plans add equation, historical and percentile screening | US and Canada |
Screening on ratings: Seeking Alpha, InvestingPro and Morningstar
Three of the paid tools let you screen on their own research, not only on raw numbers.
- Seeking Alpha Premium. Seeking Alpha’s help pages say Premium subscribers can screen with about 100 criteria, such as dividend yield, revenue growth and price performance, and can filter by Quant Rating, by the ratings of Seeking Alpha authors and Wall Street analysts, and by the five Factor Grades. You can save and name your screens, and there is a list of ready-made screens to start from (how the screener works, filters). The Quant Ratings cover US-listed stocks, so this suits US investors best.
- InvestingPro. InvestingPro Pro comes with 35 ready-made screens, and the Pro+ plan adds a screener you can build yourself with 1,200+ metrics, covering the US and 70+ other markets. That makes it one of the options here for screening stocks outside the US. If you would rather start from a ready-made dividend list, see how the Rock Solid Dividends strategy picks stocks.
- Morningstar Investor. Morningstar’s screener covers stocks, ETFs, mutual funds and closed-end funds, and you can filter and sort by its analysts’ star ratings, fair value estimates and moat ratings. AI Quick Filters let you type a request in plain words, for example “Five star stocks with a dividend yield above 3%”, and the AI sets the filters. Morningstar notes that the AI can make mistakes, so check the filters it picks (AI Quick Filters, screener). There is no free plan, but there is a 7-day free trial (try Morningstar Investor). To see how it compares with Seeking Alpha, read Morningstar vs Seeking Alpha.
Ratings and grades are a starting point for your own research. They are the provider’s opinion, built from data, and they change.
Free or paid: what you actually pay for
The free screeners above are enough to learn and to run simple screens. Paid plans usually add one or more of these:
- Real-time data instead of delayed quotes (for example Finviz Elite).
- More filters and metrics (for example InvestingPro Pro+ with 1,200+ metrics, or Stock Rover’s higher plans with historical screening).
- Screening on ratings and grades (for example Seeking Alpha Premium’s Quant Ratings and Factor Grades).
- Saved screens and alerts that tell you when a new stock starts to match (for example Simply Wall St Premium, or Finviz Elite).
- Export to a spreadsheet (for example Finviz Elite and Stock Analysis Pro).
- Longer history, so you can check numbers over 10 years or more instead of the last one or two (Koyfin Plus, Stock Analysis Pro).
Current prices for each tool are in the table further down this page, and every tool’s plans are side by side in our price tracker. Check the official site before you pay, as plans change.
How to choose a screener
Ask yourself these questions, in this order:
- Which market do you invest in? If it is mainly the US, almost every screener works. If you need the UK, Europe or the Middle East, look at InvestingPro, TradingView, Simply Wall St, Koyfin or Stock Analysis.
- What do you screen for? Mostly company numbers (valuation, growth, dividends), a provider’s ratings, or price and chart signals? Seeking Alpha Premium screens on its Quant Ratings and Factor Grades; InvestingPro Pro+ and Stock Rover go deep on fundamentals; TradingView and Finviz are strong on technical filters.
- Do you need alerts and saved screens? If you want to run the same screen every week, check how many saved screens the plan allows.
- How much detail do you want? Thousands of filters sound good but can be overwhelming. A simpler screener you actually use beats a complex one you do not.
- Can you try it first? Use a free plan or a trial before paying for a year.
If you want a full research platform rather than a screener on its own, read What is a stock research platform, and how do you choose one? or see our best stock research platforms ranking.
If you want to check stocks against Islamic finance rules, see our guide to halal stock screeners.
Frequently asked questions
Is there a free stock screener?
Yes. TradingView, Simply Wall St, Finviz, Stock Analysis and Koyfin all have a free option. The limits differ: delayed data, fewer filters, fewer saved screens or only the top results.
Can a stock screener tell me what to buy?
No. A screener only filters by the numbers you choose. It gives you a list to research further. It does not know your goals or your situation, and it is not advice.
How many filters should I use?
Start with two or three, such as market cap, sector and one valuation or dividend filter. Add more one at a time and watch how the list changes.
Why do two screeners give different results for the same filter?
Providers use different data sources and update at different times, and some calculate ratios in slightly different ways. Small differences are normal.
Prices at a glance
Prices from each official pricing page. Prices can differ by region and may exclude tax.
Research, not advice. This article explains how tools work. It is general information, not a recommendation to buy or sell any investment, and not personal advice. Investing puts your capital at risk and you can get back less than you put in. Prices and plans change, so check the official site before you pay.
Some links on this page are affiliate links. If you subscribe through them we may earn a commission, at no extra cost to you. We score every tool on the same published criteria, using facts from official pages and our own testing. How we make money. This page is general information, not personal investment advice.