

Our TrendSpider verdict
TrendSpider is a charting platform for people who trade on price charts. It draws trendlines and spots chart patterns for you, can show two timeframes on one chart, and adds a market scanner, a strategy tester for backtests, alerts, trading bots and seasonality charts. It also has Sidekick, an AI analyst that answers questions next to the chart.
Every plan includes every feature. Higher plans raise limits such as alerts, bots and backtest depth. There is no free plan for the platform, only a free Sidekick tier of 25 messages a month. A 14-day paid trial costs from USD 19, and Standard runs from USD 54 a month on the longest prepaid term to USD 89 a month billed monthly.
We signed in to Kai's own account on 4 Nov 2026 and took the screenshots below. The tools are deep and the screen is busy, so expect a learning curve. It is a lot of tool for a beginner who mainly wants to research companies rather than charts.
Who TrendSpider is for, and who it is not for
Good fit if you are
- Traders who use technical analysis and want trendlines and patterns drawn for them
- People who want to test a rule-based strategy on past data before they use it
- Traders who want scans and alerts on US stocks, ETFs, forex, crypto, futures or options
- Anyone who wants an AI assistant that can explain what a chart shows
Look elsewhere if you are
- Beginners or long-term investors who mainly read company fundamentals
- Anyone who wants a free plan or a free trial for the platform
- Investors who mainly hold UK, EU or UAE listed stocks
- People who want a simple, uncluttered screen
TrendSpider key features
Automatic trendlines and chart patterns
Switch on Trends and Chart Patterns and TrendSpider draws trendlines and Fibonacci levels for you and checks the chart for patterns such as triangles, wedges and channels. The chart legend lists every pattern it looked for and says "Not found on this chart" when there is none, which helps you see what was checked. TrendSpider also lists over 300 indicators, candlestick patterns and anchored indicators.
Source: trendspider.comMulti-timeframe analysis
The MTFA button lets you compare two timeframes on one chart, for example daily against monthly. Indicators and patterns get small badges such as D and M to show which timeframe they are calculated on, so you do not need two charts side by side.
Source: trendspider.comMarket Scanner
The scanner looks through a list of symbols, such as the S&P 500, for the conditions you set with drop-downs, for example "close at least 2% above the previous close". There are built-in samples you can copy and edit. All plans include strategy-based, multi-timeframe and scheduled scans, and higher plans refresh scans more often and allow more scheduled scans.
Source: trendspider.comSidekick AI analyst
Sidekick is a chat panel next to the chart. Ask it about a symbol and it writes a summary of indicators and price levels. All TrendSpider plans come with 25 free Sidekick messages a month, and paid Sidekick plans add more messages. In our account the panel also showed a one-off welcome gift of 50 messages for the first month. Sidekick labels its answers "not investment advice", and AI can make mistakes.
Source: trendspider.comBacktesting with the Strategy Tester
The Strategy Tester runs a set of entry and exit rules over past candles and shows net performance, win rate, number of positions and maximum drawdown, next to the result of simply holding the asset. All plans include backtesting, multi-symbol backtesting, variance testing, AI-powered backtesting and forward testing. Plans differ in backtest depth and the number of symbols per test.
Source: trendspider.comAlerts and trading bots
You can set dynamic and multi-factor alerts and build trading bots. Every plan includes 5 free automated orders a month. The number of active alerts and bots, and how long an alert lasts, depends on the plan.
Source: trendspider.comSeasonality
Seasonality profiles show how a symbol behaved in each calendar month in past years, for example the share of months that ended higher. You can choose the granularity, the measure and the start date. Past seasonal patterns can change, so this describes history, not the future.
Source: trendspider.comFundamentals, data and apps
Beside charts, all plans include analyst estimates, company fundamentals, FRED economic data, heatmaps, What's Happening Now, 700+ smart watchlists, JavaScript custom indicators and native iOS and Android apps.
Source: trendspider.comBrokerage connection
Connect to 30+ brokerages and crypto exchanges through the Trading widget. A free SignalStack account is included for manual trading.
Source: trendspider.comMarket data
Real-time US stocks and ETFs are free for non-professional users. Global forex and crypto data are also available, and futures and options data cost extra each month.
Source: trendspider.comTrendSpider prices
| Plan | Regular price | With our link | Notes |
|---|---|---|---|
| Standard | $89.00a month | $80.10Save 10% a month for 12 months Code 10TS at checkout. | USD 89 a month on monthly billing. Quarterly and yearly prepaid terms cost less, from USD 54 a month. New customers get a discount on the first invoice. |
| Premium | $149.00a month | $134.10Save 10% a month for 12 months Code 10TS at checkout. | USD 149 a month on monthly billing. Quarterly and yearly prepaid terms cost less, from USD 91 a month. New customers get a discount on the first invoice. |
| Enhanced | $199.00a month | $179.10Save 10% a month for 12 months Code 10TS at checkout. | USD 199 a month on monthly billing. Quarterly and yearly prepaid terms cost less, from USD 122 a month. New customers get a discount on the first invoice. |
| Advanced | $349.00a month | $314.10Save 10% a month for 12 months Code 10TS at checkout. | USD 349 a month on monthly billing. Quarterly and yearly prepaid terms cost less, from USD 214 a month. New customers get a discount on the first invoice. |
What changes between TrendSpider plans
Every plan has the same features. What changes is how much you can use them. These limits are from TrendSpider's pricing page, read on 4 Nov 2026.
| Limit | Standard | Premium | Enhanced | Advanced |
|---|---|---|---|---|
| Workspaces | 5 | 10 | 15 | 20 |
| Active alerts (how long they last) | 10 (30 days) | 50 (90 days) | 100 (180 days) | 400 (365 days) |
| Trading bots | 5 | 10 | 50 | 100 |
| Backtest depth (candles) | 2,000 | 10,000 | 20,000 | 30,000 |
| Symbols per backtest | 50 | 150 | 250 | 510 |
| Scheduled scans | 3 | 5 | 7 | 10 |
| Sidekick messages a month | 25 | 25 | 25 | 25 |
| Support | Standard | Standard | Priority | Priority |
If you mainly want to learn charting, Standard already has every tool. Higher plans matter when you run many alerts or bots, or long backtests on many symbols.
TrendSpider pros and cons
Pros
- Draws trendlines and finds chart patterns for you, and shows which patterns it checked
- All features on every plan, including backtesting, scanning, alerts and Sidekick
- Multi-timeframe charts, seasonality and a scanner you set up without code
- 25 free Sidekick AI messages a month on every plan
- Code 10TS gives 10% off any plan for 12 months
Cons
- No free plan, and the 14-day trial costs from USD 19
- Busy screen with many panels, so it takes time to learn
- Refunds only within 72 hours of a full charge, and the trial fee is not refunded
- Lower plans have tighter limits on alerts, bots and backtest depth
- Expensive for a beginner, and futures and options data cost extra
Guided tour: how TrendSpider looks inside
The same screens as above, in order, as a step-by-step tour. Each step zooms in on one part of the page.
Inside TrendSpider, step by step
We walk through a chart with automatic trendlines, multi-timeframe analysis, the scanner, the Sidekick AI, a sample backtest, alerts and seasonality. Use Next, the step list or your arrow keys. On a phone you can swipe.
-
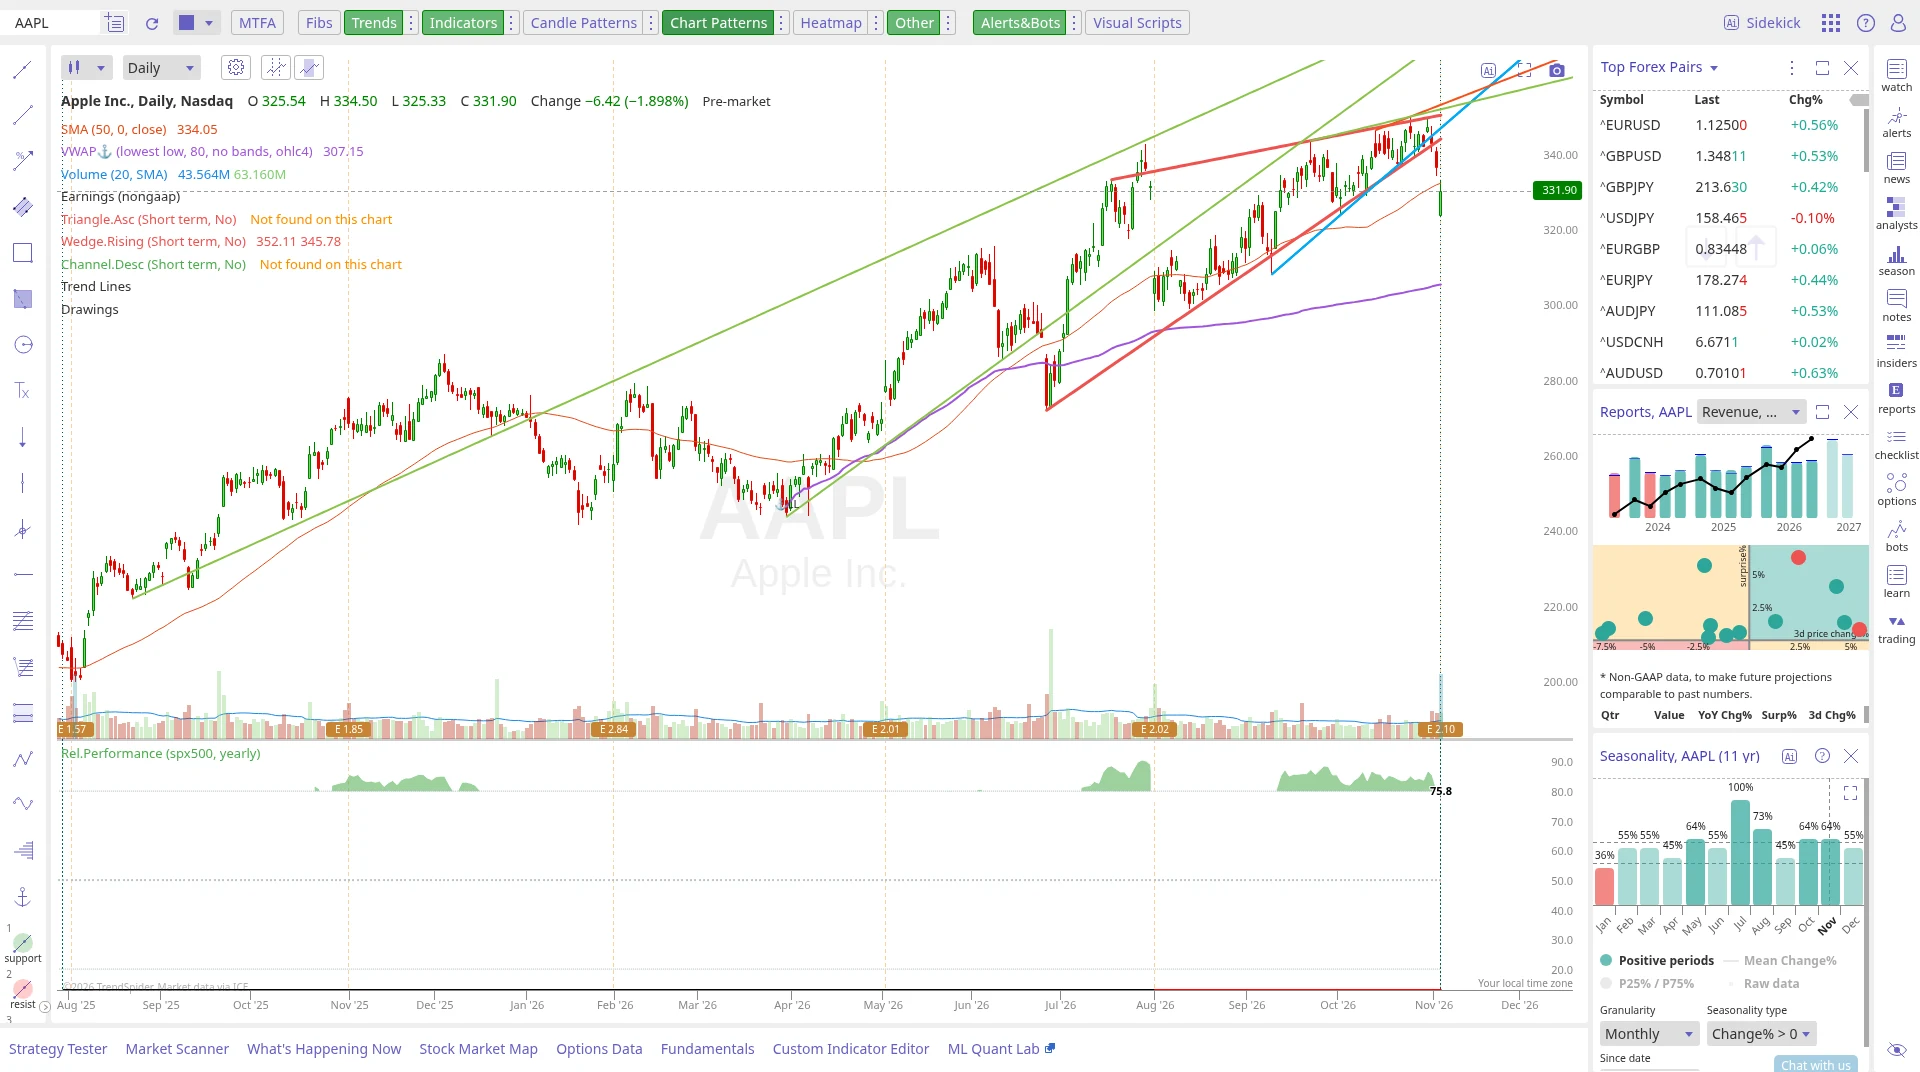
Step 1 of 7A chart that draws its own trendlinesWith Trends and Chart Patterns switched on in the top toolbar, TrendSpider draws trendlines and looks for patterns by itself. The legend lists each pattern it checked, such as a rising wedge it found and an ascending triangle it did not.Open full screenshot -
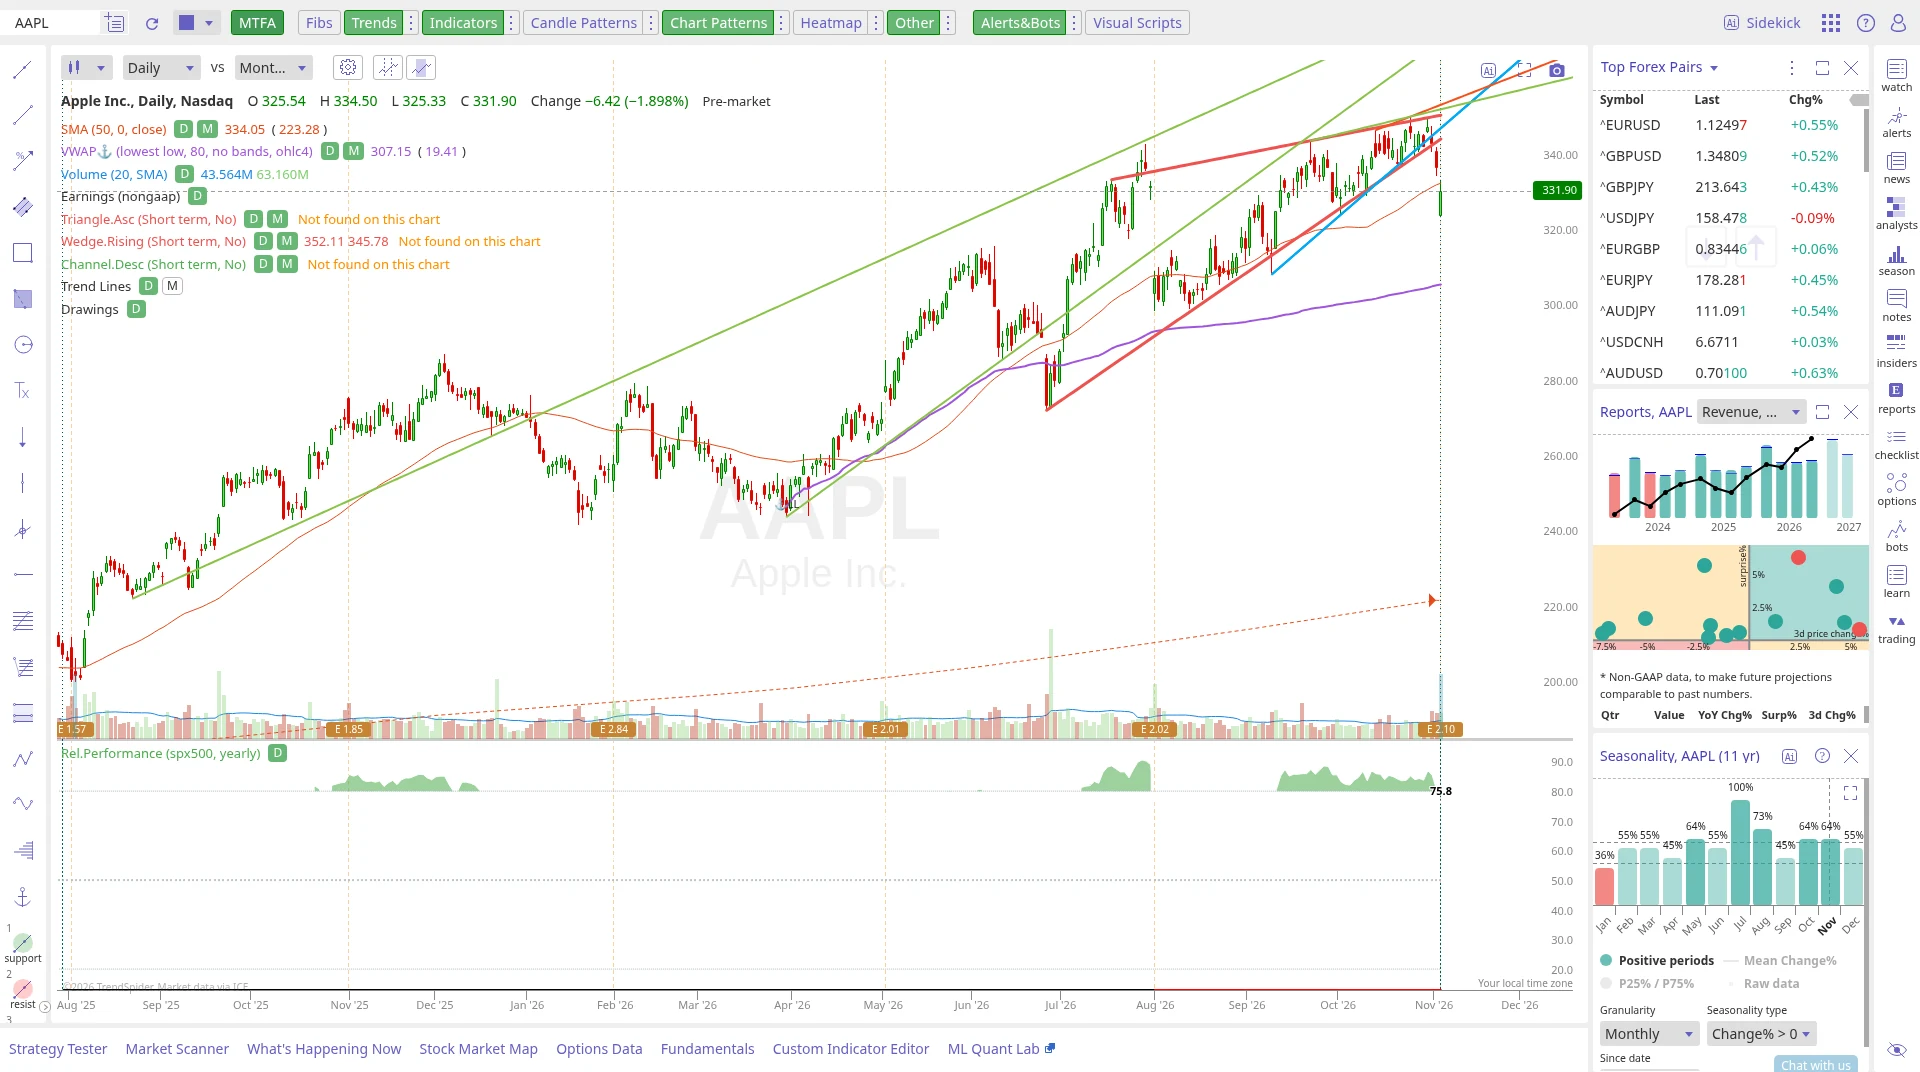
Step 2 of 7Two timeframes on one chartThe MTFA button turns on multi-timeframe analysis. Here the daily chart is compared with the monthly one, and the D and M badges show which timeframes each indicator and pattern is calculated on.Open full screenshot -
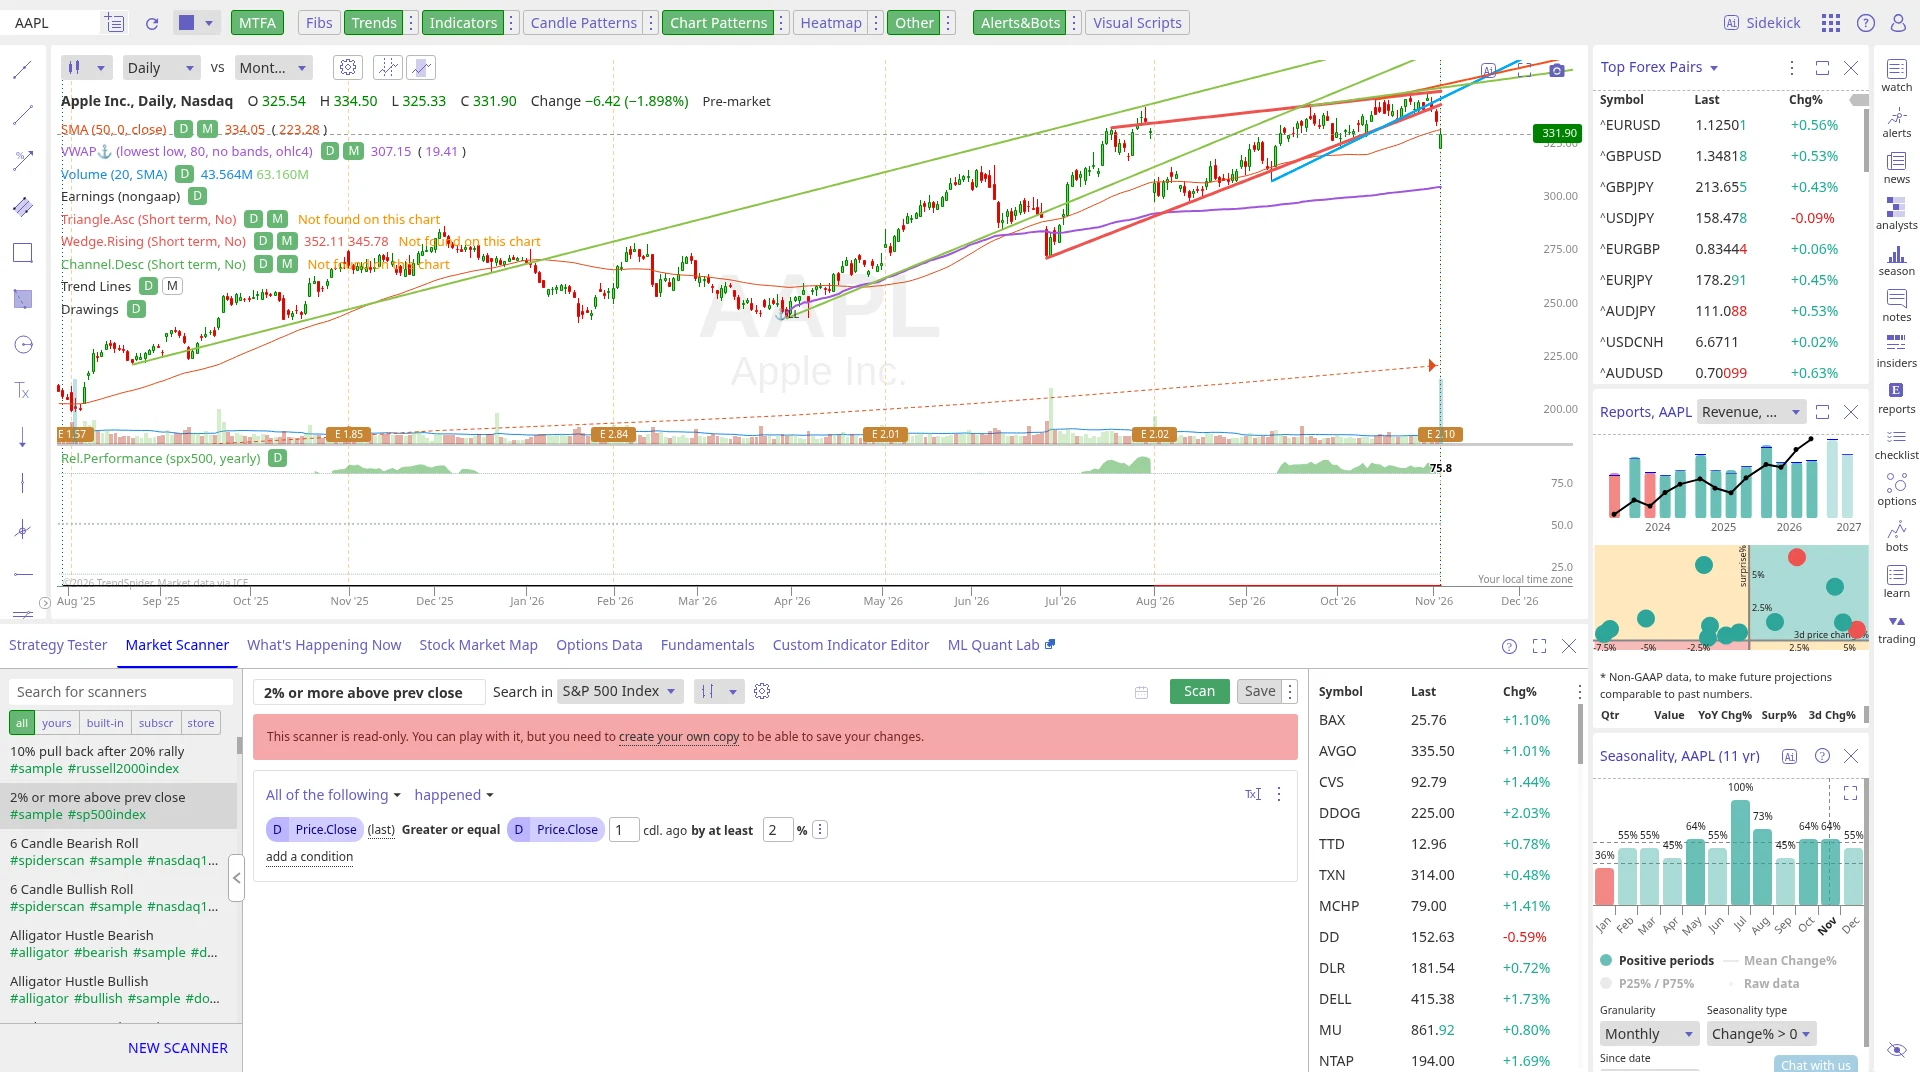
Step 3 of 7Scan a market for a conditionThe Market Scanner tab under the chart lists saved and sample scanners. This sample looks for S&P 500 stocks that closed at least 2% above the previous close. You set conditions with drop-downs instead of code, then press Scan.Open full screenshot -
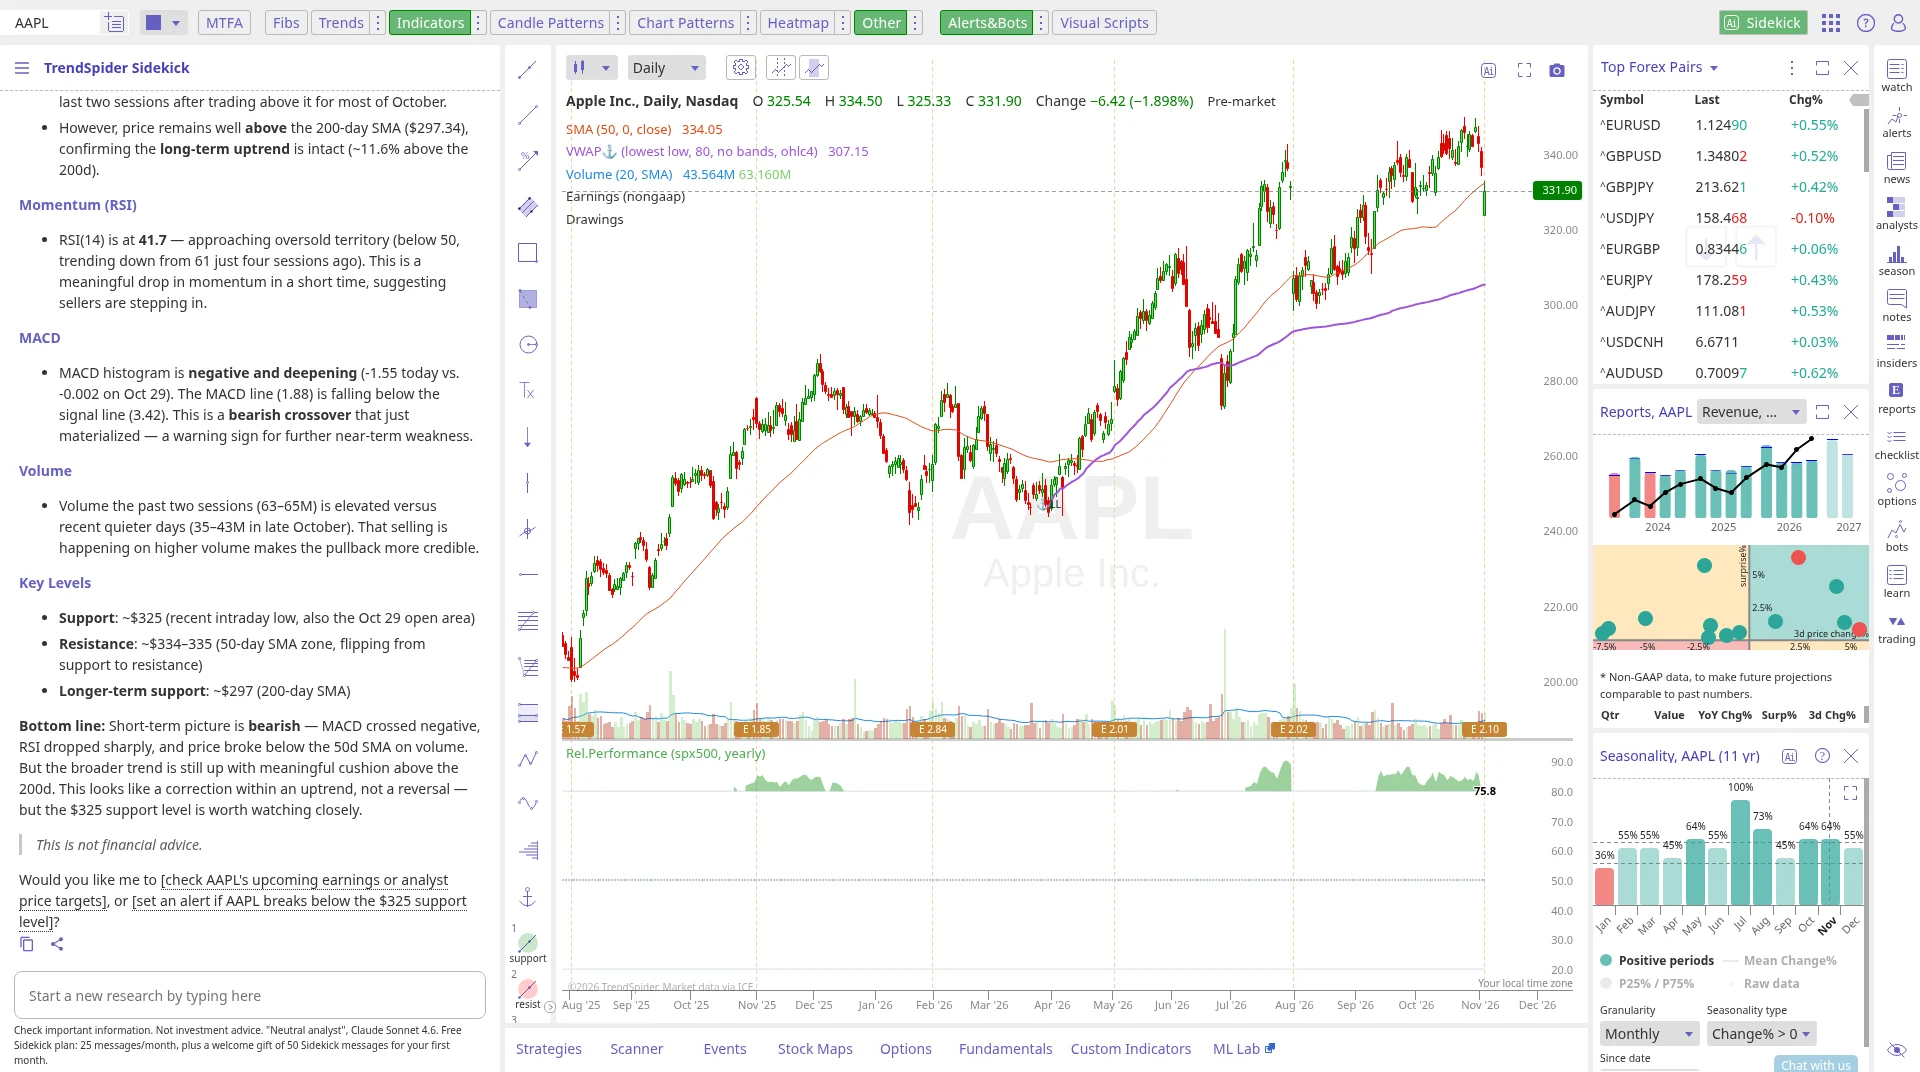
Step 4 of 7Ask Sidekick, the AI analystSidekick opens next to the chart. Asked about Apple, it wrote a summary of momentum, MACD, volume and support and resistance levels. The panel showed 25 free messages a month on the free Sidekick plan, and it says its answers are not investment advice.Open full screenshot -
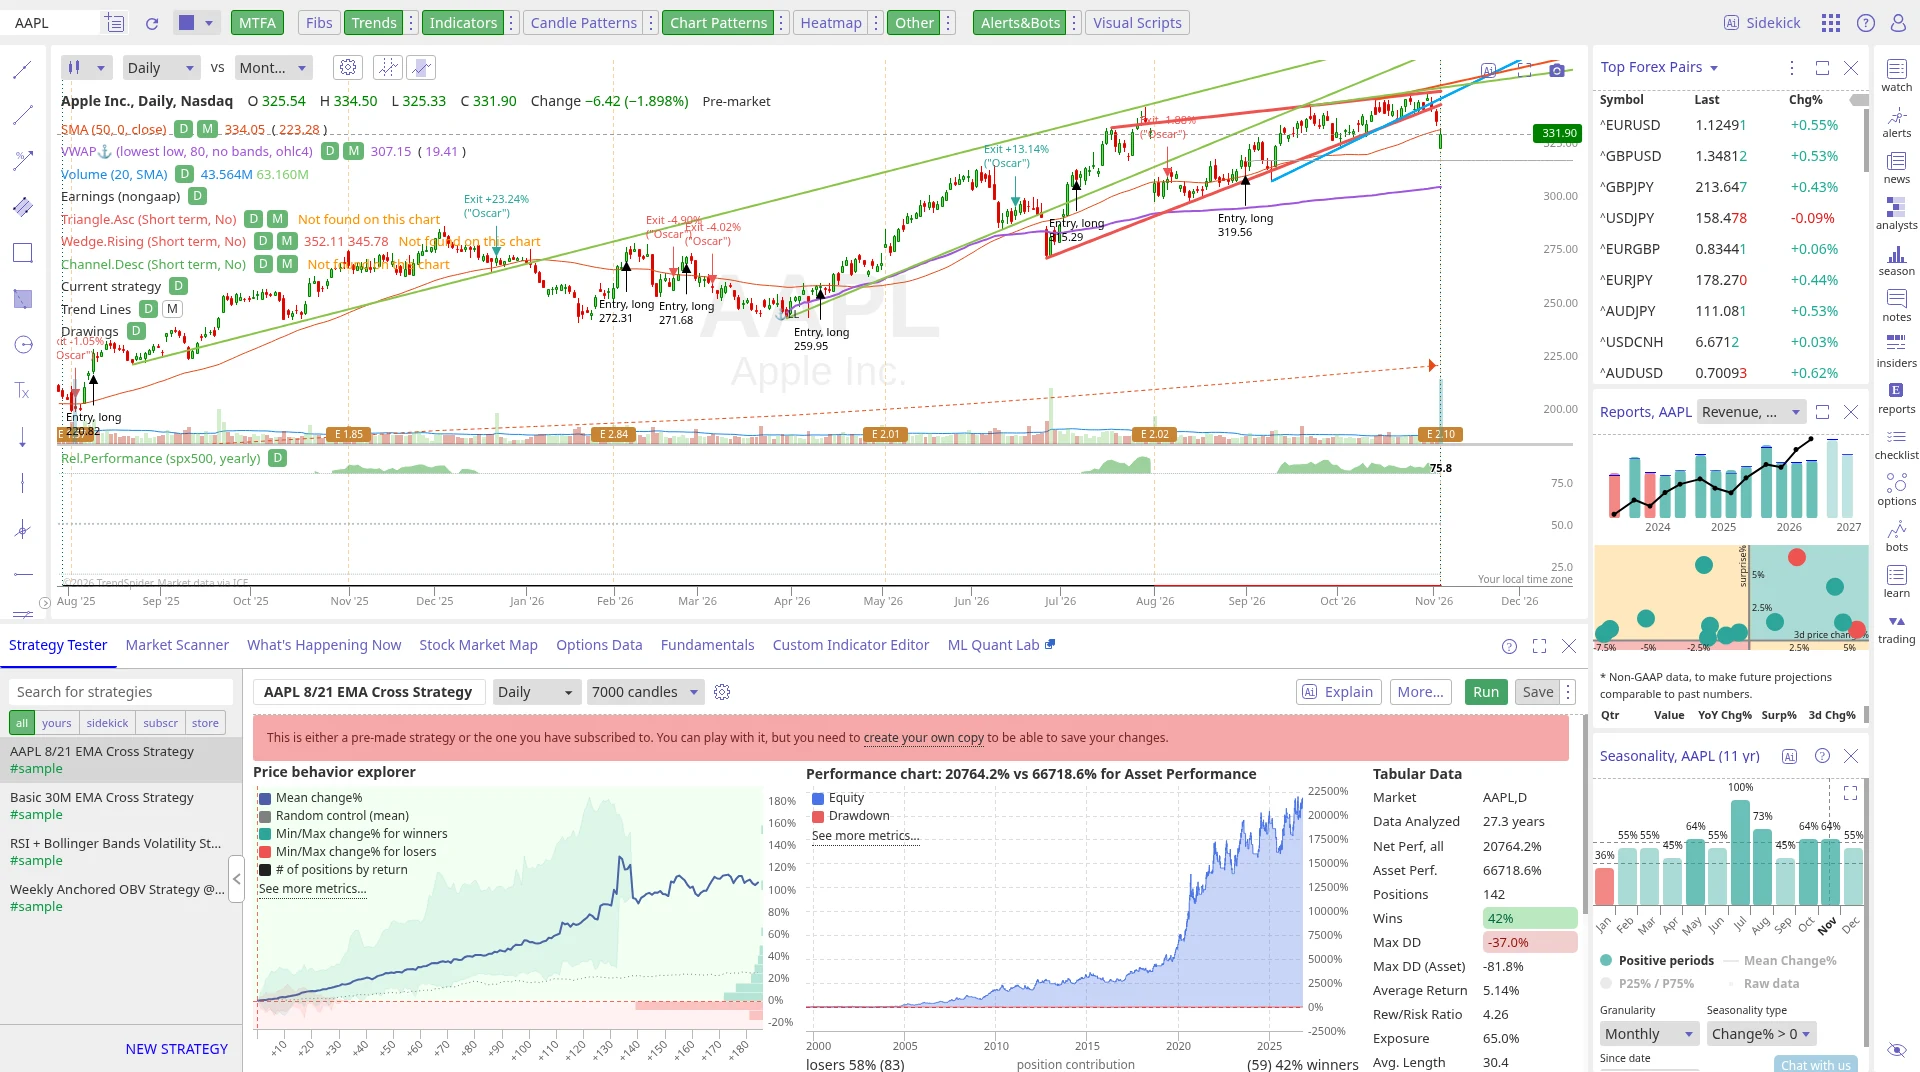
Step 5 of 7Backtest a strategy on past dataThe Strategy Tester runs a strategy over past candles. This pre-made sample tested an 8/21 EMA cross on Apple over 27.3 years: 142 positions, 42% winners and a performance chart against simply holding the stock. Entry and exit points also appear on the chart.Open full screenshot -
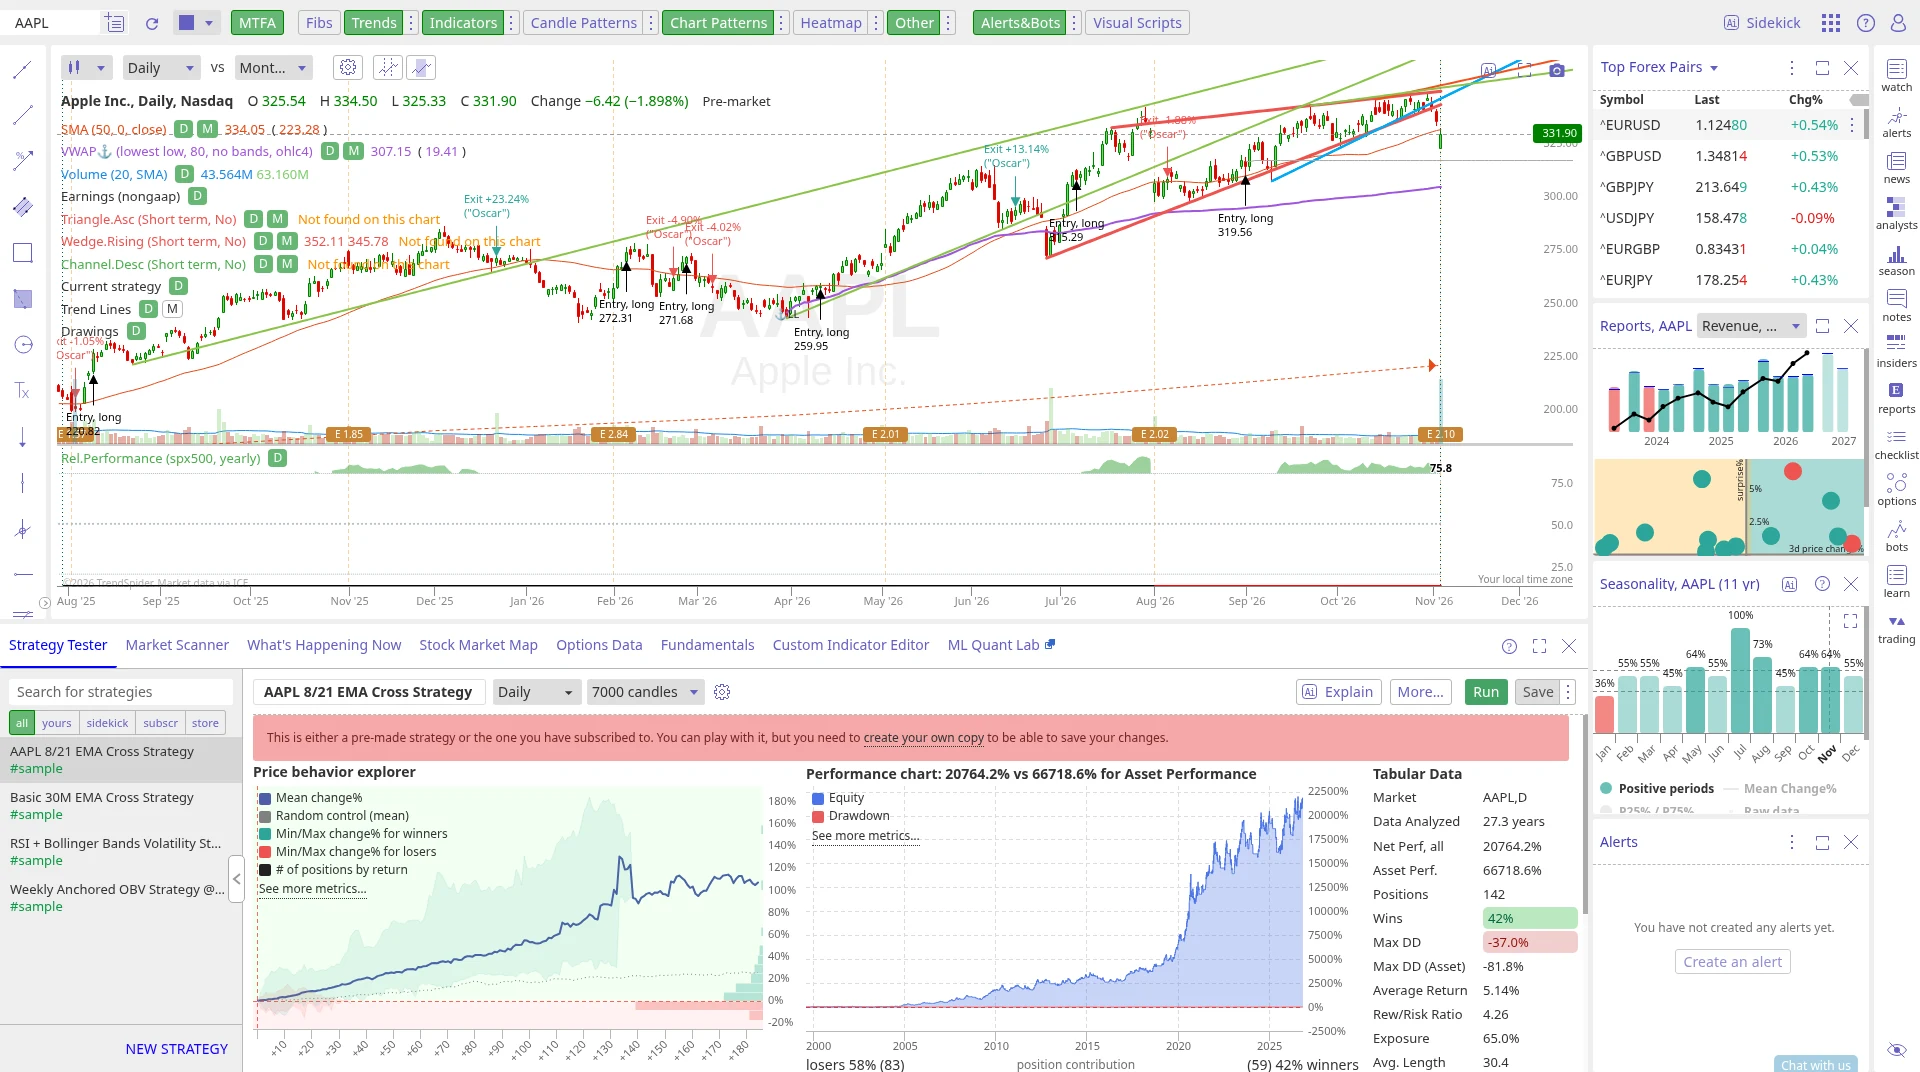
Step 6 of 7AlertsThe Alerts widget lists your alerts and has a Create an alert button. The number of alerts you can keep active depends on your plan.Open full screenshot -
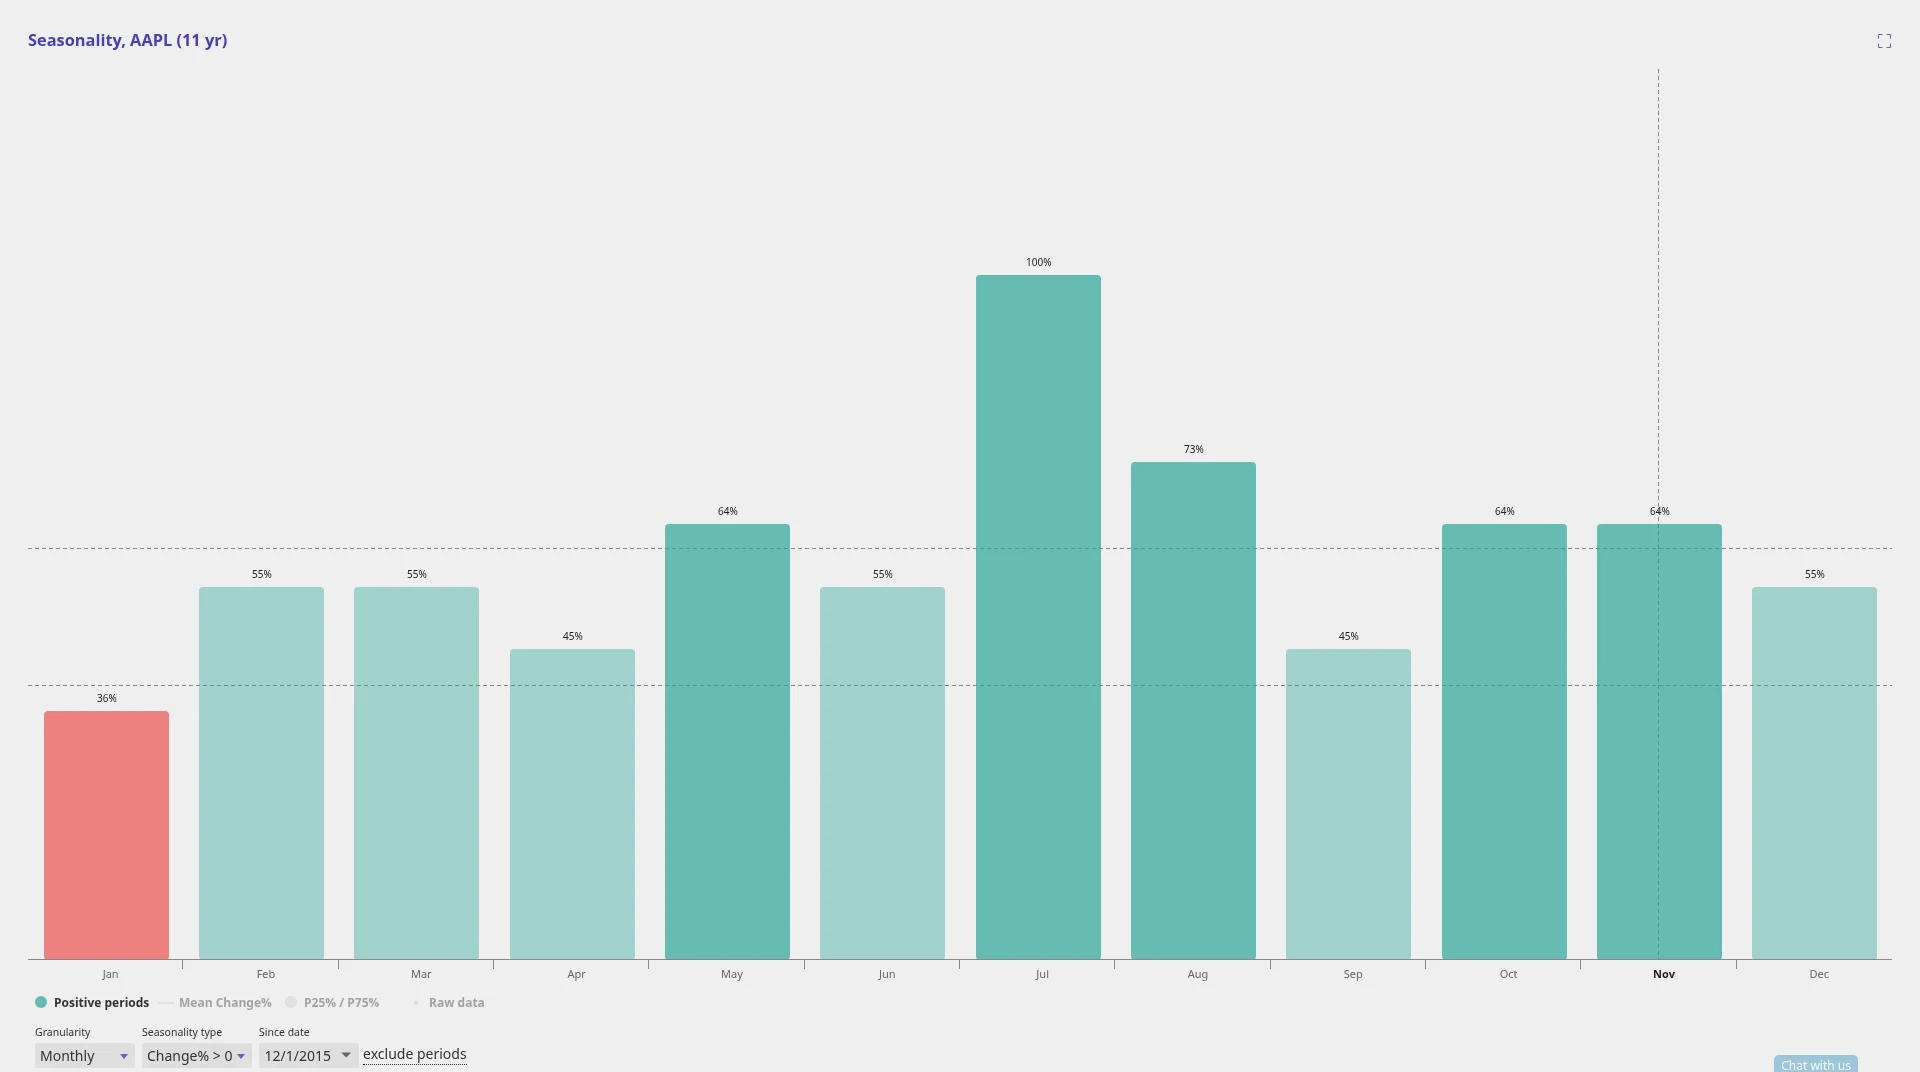
Step 7 of 7Seasonality: how each month went beforeThe Seasonality view shows, for each calendar month, how often Apple ended the month higher since December 2015. You can change the granularity, the measure and the start date. It describes the past only.Open full screenshot
Screens from Kai's own TrendSpider account, captured 4 Nov 2026. Apple and the other symbols are examples of how the screens look, not recommendations. The backtest is a pre-made sample on past data and does not predict future results. Sidekick output is not advice.
Where TrendSpider ranks
We rank tools by job, not overall. TrendSpider is ranked in one of our job lists. We score every tool on the same published criteria, using facts from official pages and our own testing. How we score.
TrendSpider alternatives



TrendSpider FAQ: common questions
Does TrendSpider have a free plan?
No, not for the charting platform. Its AI analyst Sidekick has a free tier of 25 messages a month, and every paid plan includes those messages too.
Is there a free trial?
No free trial. TrendSpider offers a 14-day paid trial from USD 19, depending on the plan. Trial fees are not refunded. During sales the trial offer can differ, so check the pricing page before you start.
What does TrendSpider cost?
Standard is USD 89 a month billed monthly, and less on prepaid terms (from USD 54 a month). Premium, Enhanced and Advanced cost more and raise the usage limits, not the features.
Is there a TrendSpider coupon code?
Yes. Code 10TS gives 10% off any plan for 12 months. Enter it at checkout. During the Black Friday sale (6 to 27 Nov 2026) the pricing page offers up to 65% off the first year instead, and its terms say promotional discounts cannot be combined with other offers, so 10TS does not stack with the sale price. Sale plans are final and non-refundable.
Is there a TrendSpider Black Friday sale?
Yes, from 6 to 27 Nov 2026 (read on the pricing page on 8 Nov 2026): up to 65% off the first year depending on plan and term, 7-day trials for USD 7 until 15 Nov, and a free Sidekick Plus and SignalStack Pro bonus that gets smaller each week. Promotional plans are final and non-refundable, so check the terms before you pay.
What is TrendSpider Sidekick?
Sidekick is TrendSpider's AI analyst. It sits in a panel next to the chart and answers questions about a symbol, for example by summarising indicators and support and resistance levels. All plans include 25 messages a month, and you can buy a Sidekick plan for more. Its answers are not investment advice.
Does TrendSpider draw trendlines automatically?
Yes. With Trends and Chart Patterns switched on, it draws trendlines and Fibonacci levels and checks the chart for patterns. The legend shows which patterns it found and which it did not.
Can I backtest a strategy without coding?
Yes. The Strategy Tester lets you build entry and exit rules and run them on past data, and there are pre-made samples to start from. Backtest results are hypothetical and do not predict future returns.
Can I connect TrendSpider to my broker?
Yes. TrendSpider says you can connect to 30+ brokerages and crypto exchanges through the Trading widget, with a free SignalStack account included for manual trading.
Which markets does it cover?
Real-time US stocks and ETFs (free for non-professionals), global forex and crypto, plus futures and options data for extra monthly fees. UK, EU and UAE stocks are not listed.
Is there a mobile app?
Yes. All plans include native iOS and Android apps, plus browser extensions.
Can I get a refund?
TrendSpider allows refund requests within 72 hours of the first full charge, minus the trial fee. Trial fees are not refunded, and plans bought in a sale can be final.
Some links are affiliate links, so we may earn a commission at no extra cost to you. How we make money. General information, not personal investment advice. Ratings and fair value estimates are model outputs or opinions and can be wrong.