







A portfolio analyzer looks at the holdings you already have and shows how they fit together. It can split your money by asset class, sector or country, look inside funds for overlap, measure your return including fees and dividends, and compare the whole portfolio with a benchmark.
That is different from a simple portfolio tracker, which mainly lists balances, and from a net worth tracker, which adds cash, property and debts. Many apps do more than one of these jobs. This page focuses on the analysis: allocation, overlap, risk and returns. Facts come from official pages and our reviews, checked on 12 Nov 2026, and can change. It is general information, not advice on what to buy, sell or how to allocate your money.
For analysis of a live portfolio you already hold, start with Snowball Analytics or, if you want a look inside your funds, Morningstar's Portfolio X-Ray. For a free model portfolio you type in yourself, use Portfolio Visualizer.
Portfolio analyzer tools at a glance
| Tool | Best for | What the analysis shows | Free plan | Paid from |
|---|---|---|---|---|
| Snowball Analytics | Returns, dividends and diversification | Performance including fees and dividends, split by sector, class and region, plus backtests | Yes, 1 portfolio and 10 holdings | USD 6.67 a month billed yearly |
| Morningstar Investor | A look inside funds and ETFs | Portfolio X-Ray: asset class, 12 sectors, regions, fees, style boxes and stock overlap, against a benchmark | No. Some quote pages are public | USD 199 for the first year |
| Sharesight | Performance, contribution and tax reports | Performance, contribution analysis, multi-currency valuation, drawdown risk and an Exposure Report | Yes, 1 portfolio and 10 holdings | USD 7 a month billed yearly |
| getquin | A free overview, with deeper analysis on Premium | Allocation by holding, region and sector. Premium adds benchmarks, time-weighted return, ETF DeepDive and an AI score | Yes, unlimited bank and broker connections | EUR 89.99 a year |
| Portfolio Visualizer | Backtests of a model portfolio | Backtesting, Monte Carlo simulation, optimization, factor regression and asset analytics | Yes, no login, up to 15 assets | USD 30 a month billed annually |
| Stock Rover | Spreadsheet-style research plus a linked portfolio | Portfolio tools with broker links, next to a 300+ metric screener | Yes, basic research. Two broker connections | USD 29 a month billed yearly |
| Ziggma | A simple checkup on US holdings | A Portfolio Checkup for concentration, weak holdings and risks, plus a 0 to 100 stock score | Yes, tracker, 3 virtual portfolios, dividend tracker and screener | USD 6.99 a month billed yearly |
Prices are from official pricing pages and our tool data. Taxes can be added at checkout, and prices can change.
What a portfolio analyzer does
Most tools in this guide cover some mix of the following:
- Allocation: how your money is split, for example by stock, fund, sector, country or asset class.
- Overlap: whether the same company appears in several funds you hold, so one name is a larger share of your money than it looks.
- Returns: how the portfolio has done, ideally including dividends, fees and the effect of money you added or took out.
- Risk and style: measures such as how much the portfolio moves with the market, fees inside funds, or whether holdings lean toward large or small companies, growth or value.
- A benchmark: a comparison with an index or a model mix, so you can see how the portfolio differs, not only how it did.
The figures depend on the data the tool has, the date of the fund holdings, and the method it uses. Two analyzers can disagree on the same portfolio. For a closer look at fund overlap alone, see our guide to ETF overlap tools.
Snowball Analytics: returns, dividends and diversification
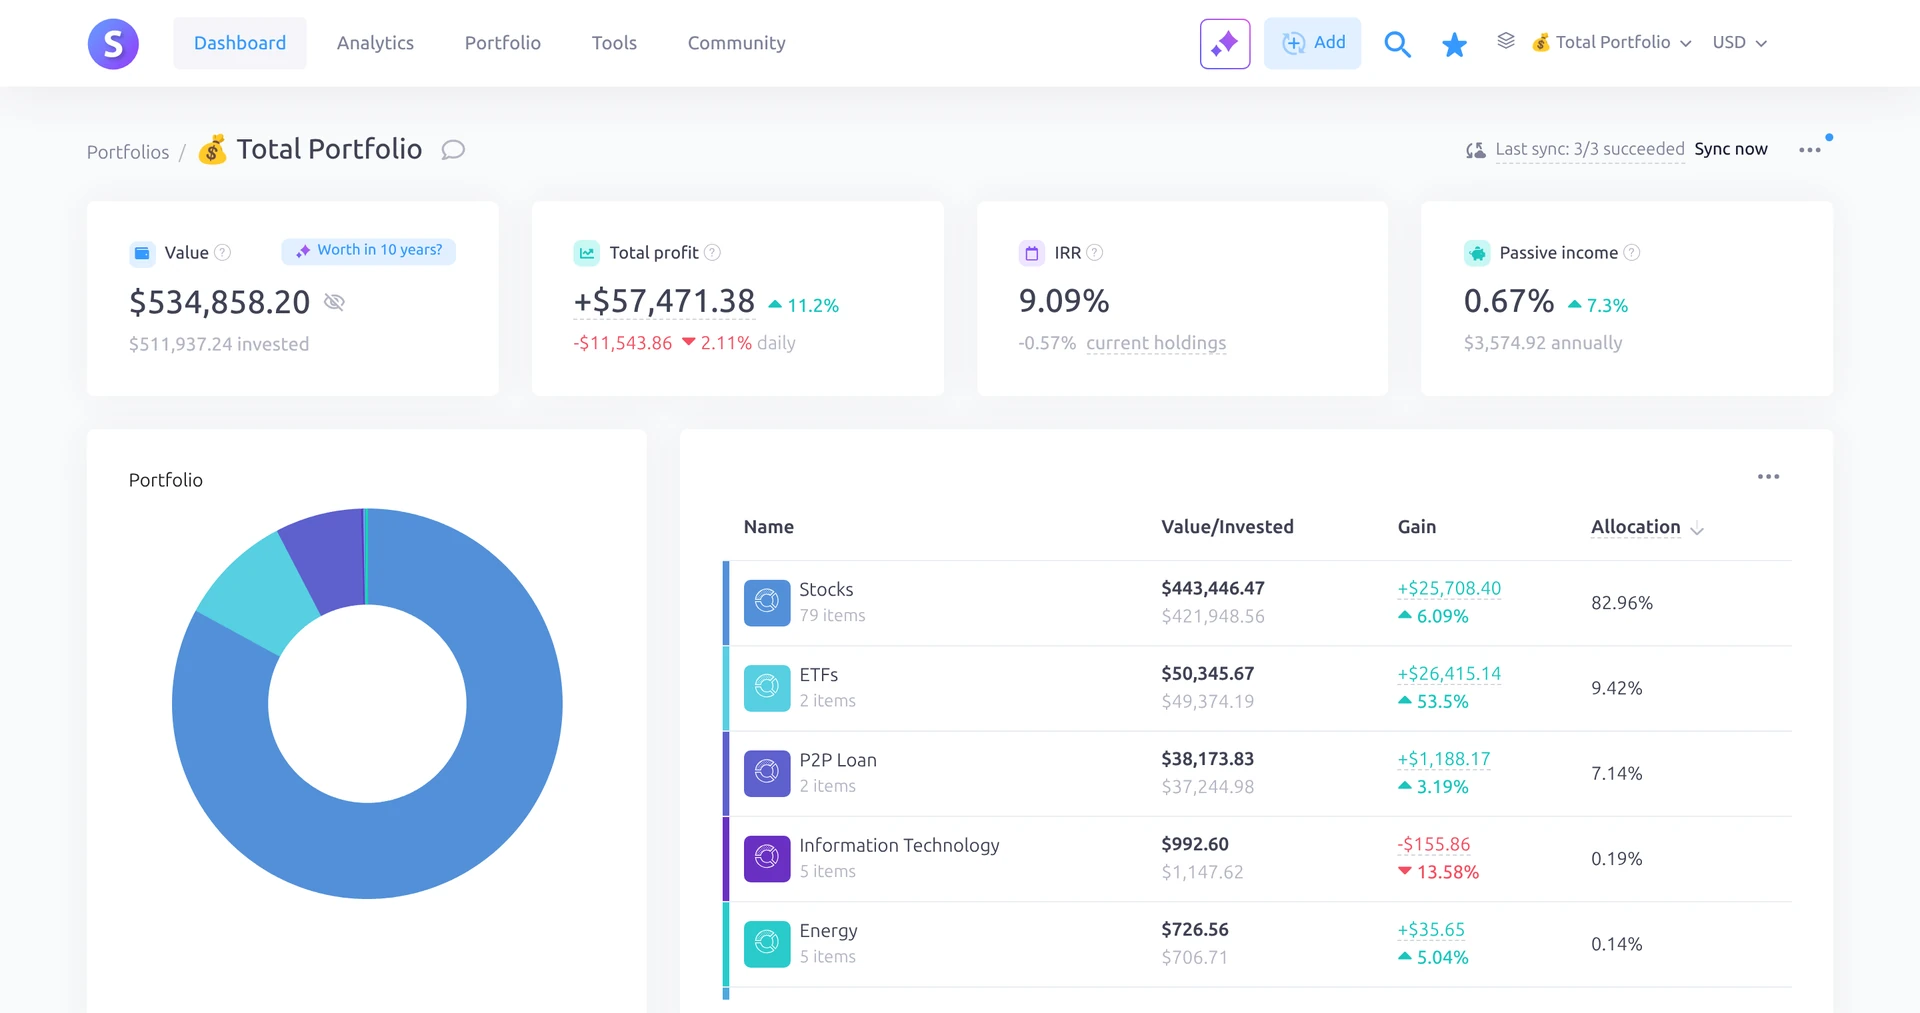
Snowball Analytics is a portfolio tracker with a clear analysis layer. It works out your return including fees and dividends, shows a dividend calendar and income forecast, and breaks holdings down by sector, asset class and region. Official pricing also lists metrics such as the price-to-earnings ratio, beta (how much holdings move with the market) and the Sharpe ratio (return for the risk taken), plus backtests with more than 30 years of data. You can link or import accounts from over 1,000 brokers.
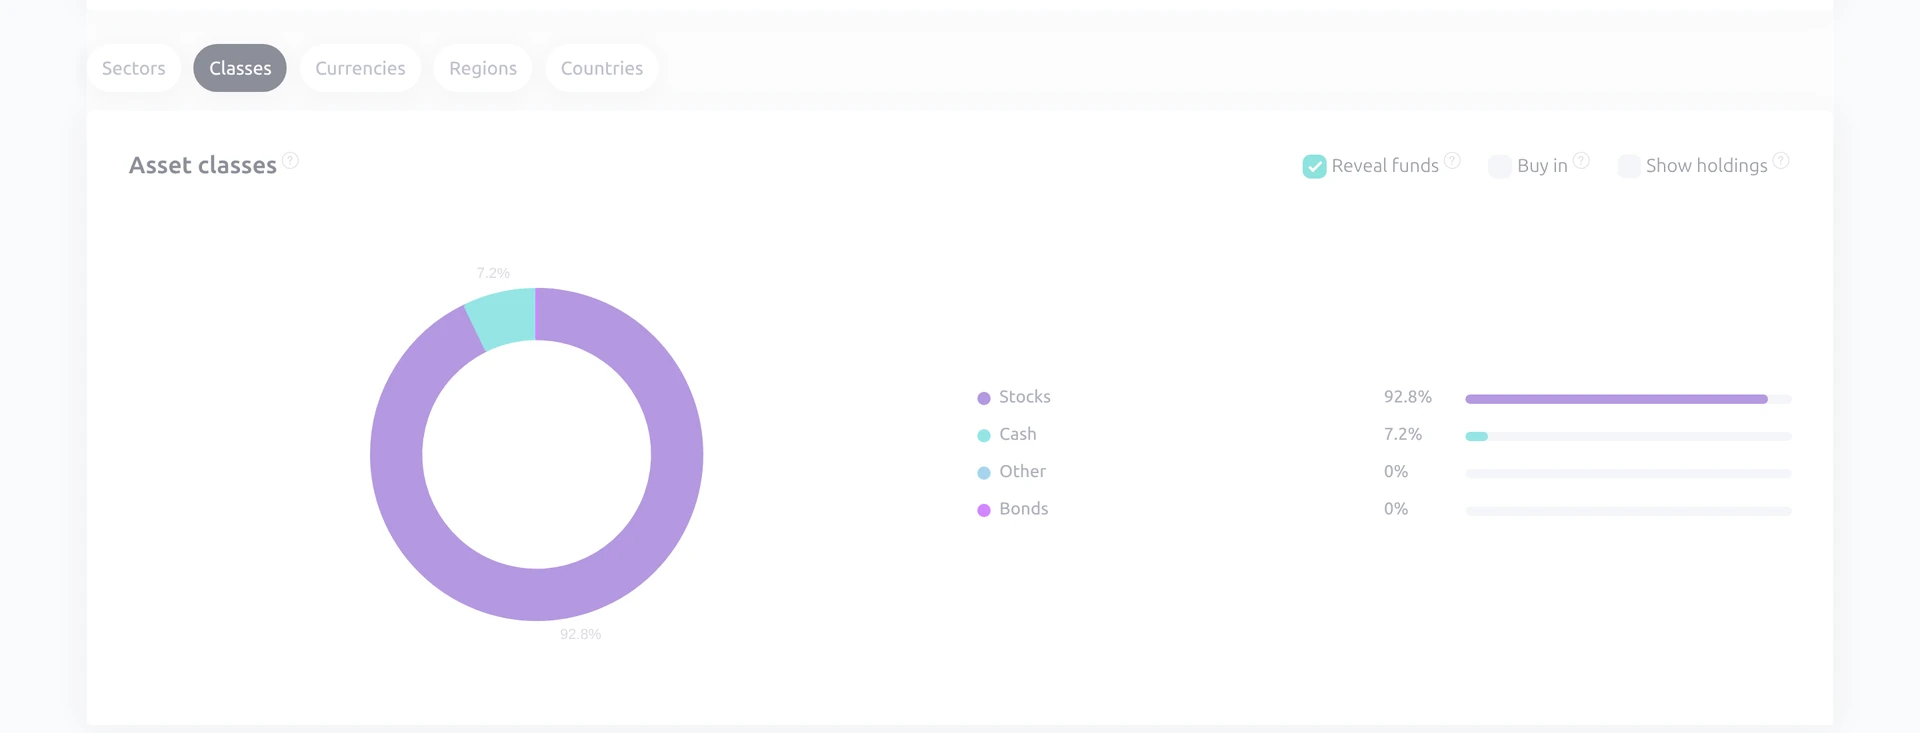
- Free plan: 1 portfolio, 10 holdings, 1 watchlist, a dividend calendar and broker report import.
- Paid: Starter from USD 6.67 a month billed yearly. Every paid plan has a 14-day free trial with no card needed.
- Suits: investors who want returns and dividend analysis on a live portfolio.
- Less suited to: a full household balance sheet, or a look inside every fund in the style of Morningstar X-Ray.
Snowball ranks first in our portfolio tracker ranking. See our Snowball Analytics review.
Morningstar Investor: X-Ray inside your funds
Morningstar’s Portfolio X-Ray is built for portfolios that mix funds, ETFs and stocks. The official help page says it breaks the portfolio down by asset class, 12 stock sectors, world regions, fees (including a weighted average expense ratio), stock statistics such as price-to-book and price-to-earnings, and equity and fixed-income style boxes, all compared with a benchmark you choose, from aggressive to conservative. When you open a view, a holdings breakdown shows which securities are driving an overweight or underweight against that benchmark.
Morningstar also has Stock Intersection, which shows the same stock appearing in several funds. X-Ray works for portfolios of up to 150 holdings. Investor is a paid plan, with a 7-day free trial (one per person). Through our link the first year is USD 199, then USD 249 a year at the regular price.
- Free plan: none for Investor. Some quote pages are public.
- Paid: Morningstar Investor, with the first-year offer and trial above.
- Suits: long-term investors who hold several funds and want fees, sectors and overlap in one view, next to Morningstar’s analyst research.
- Less suited to: a free, everyday tracker for trades and dividends.
See our Morningstar Investor review and our ETF overlap tools guide, which also covers X-Ray and Stock Intersection.
Sharesight: performance, contribution and exposure
Sharesight is a portfolio tracker known for dividend and tax reports. Its analysis sits in the reports. All plans include Performance, Sold Securities and All Trades reports. Standard and Premium add Future Income, Contribution Analysis, Multi-Currency Valuation and Drawdown Risk. Paid plans also have an Exposure Report, which Sharesight describes as an X-Ray tool for seeing a stock held both directly and inside ETFs. Free users can explore the advanced reports on a demo portfolio.
- Free plan: 1 portfolio and 10 holdings, including closed positions. No tax reports on the free plan. Price and portfolio email alerts are included on all plans.
- Paid: Starter from USD 7 a month billed yearly. A free trial for individual plans is not listed on the pricing page.
- Suits: investors who want performance and tax reports across brokers and currencies, including UK and European holdings.
- Less suited to: finding or rating new stocks, or staying free with more than 10 holdings.
See our Sharesight review.
getquin: a free overview, with deeper analysis on Premium
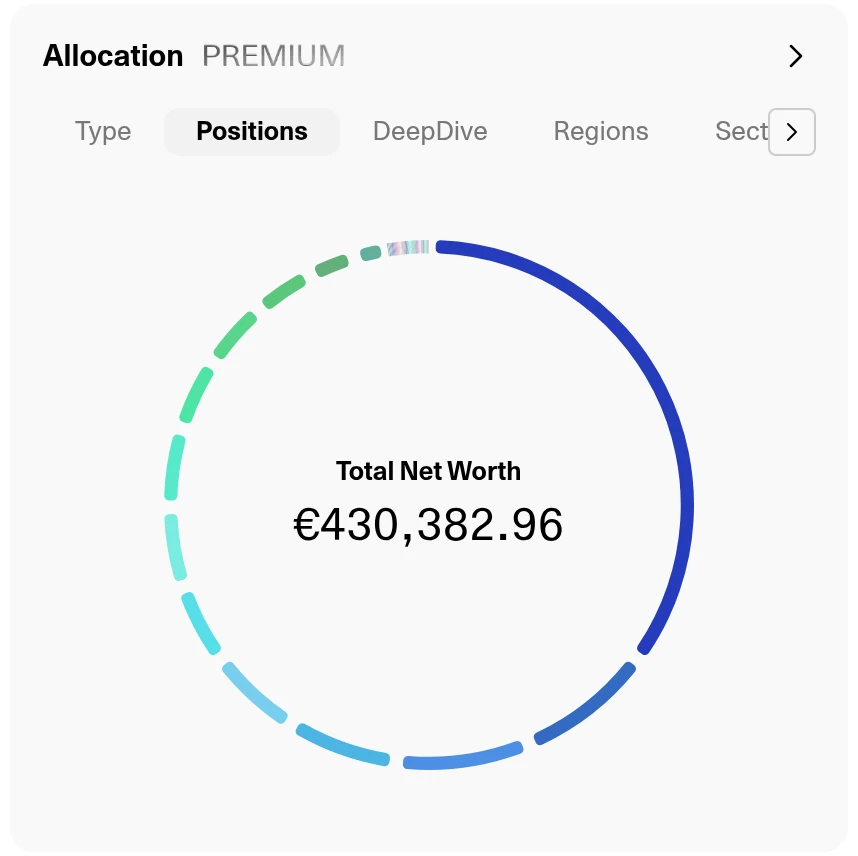
getquin’s free plan already links unlimited banks and brokers and shows a net worth overview, an investments total and an essential portfolio view. The deeper analyzer features are on Premium: time-weighted return and IRR, a benchmark against an index, stock, ETF or another of your portfolios, DeepDive (which looks inside ETFs and adds those holdings to your direct positions), and an AI portfolio analysis scored across diversification, risk, fees and how the portfolio may behave in different market phases. Premium includes 15 AI analyses a month. getquin says only the ISIN, weight and data such as sector and country are sent, not amounts or personal data, and that the AI can make mistakes.
- Free plan: unlimited bank and broker connections, real-time data, net worth, a dividend calendar and essential portfolio analysis.
- Paid: Premium at EUR 89.99 a year, with a 7-day free trial once per user. Wealth is EUR 149.99 a year.
- Suits: investors with several brokers who want a free overview first, then paid analysis.
- Less suited to: a tax report for filing, which getquin does not offer.
See our getquin review.
Portfolio Visualizer: a free backtest of a model portfolio
Portfolio Visualizer is a web tool for analysing a portfolio you enter yourself, rather than a live feed from your broker. The official pricing page, checked on 12 Nov 2026, lists a free plan for personal and educational use with no login required. It includes portfolio backtesting, Monte Carlo simulation, portfolio optimization, factor regression, asset analytics and tactical allocation models. The free tier supports up to 15 assets, has limited history and excludes the current month-to-date results.
Paid plans, billed annually, are Basic at USD 30 a month and Pro at USD 55 a month. Basic and Pro support up to 150 assets with year-to-date results. Basic can save 50 portfolio models and Pro can save 150. The site states that outputs, including backtests, are hypothetical, are not investment advice and are not a guarantee of future results.
- What is free: the core analysis tools, with the 15-asset and history limits above, and no login.
- Paid: Basic from USD 30 a month billed annually, or Pro from USD 55 a month billed annually, for personal or (on Pro) commercial use.
- Suits: people who want to test a model mix of funds or asset classes on past data.
- Less suited to: tracking a live broker account, dividends or tax.
Other useful analyzers
Stock Rover is a research and screening tool that also includes portfolio tools with broker links (Brokerage Connect through Yodlee, updated nightly; free users get 2 connections). The entry Premium plan includes screening with more than 300 metrics. There is a free plan with basic research, and a 14-day free trial of any paid plan with no card. Premium starts at USD 29 a month billed yearly. It is strongest for US and Canadian stocks. See our Stock Rover review.
Ziggma combines a portfolio tracker with a Ziggma Stock Score (0 to 100) and a Portfolio Checkup that points out concentration, weak holdings and risks, each tied to a metric. The free plan includes the tracker, 3 virtual portfolios, a dividend tracker and a stock and ETF screener. Paid plans start at USD 6.99 a month billed yearly, with a 7-day free trial. Non-US holdings get no analysis. See our Ziggma review.
Simply Wall St is easier to read than a spreadsheet. The free plan has 1 portfolio with 10 holdings. Premium adds 3 advanced portfolios with 30 holdings each, and Unlimited removes the limits. Broker sync and full dividend analysis are on paid plans. New accounts get 7 days of Premium with no card. Paid plans start at USD 10.95 a month billed yearly. See our Simply Wall St review.
The Empower Personal Dashboard is a free US option that can connect bank, investment and retirement accounts and includes a portfolio analysis next to net worth and cash flow. It suits US accounts best. Empower also sells paid wealth management; this mention covers only the free dashboard.
How to choose
- You want returns, dividends and a clear split of a live portfolio: Snowball Analytics.
- You hold several funds and want fees, sectors and overlap: Morningstar Investor (X-Ray).
- You want performance and tax reports across brokers: Sharesight.
- You want a free overview of every broker, then paid analysis: getquin.
- You want to backtest a model mix without linking a broker: Portfolio Visualizer.
- You already research stocks in spreadsheets: Stock Rover.
- You want a simple checkup and scores on US holdings: Ziggma.
Start with a free plan or trial. A portfolio analyzer describes what you hold. It does not tell you what to change.
Frequently asked questions
What is a portfolio analyzer?
It is a tool that takes your holdings and shows how they fit together: the split by asset class, sector or country, any overlap between funds, your return, and often a comparison with a benchmark. Some tools also estimate risk or fees.
What is the best free portfolio analyzer?
It depends on whether you want to analyse a live account or a model. getquin’s free plan links unlimited banks and brokers. Snowball and Sharesight have free plans for 10 holdings. Portfolio Visualizer is free for model portfolios of up to 15 assets, with no login. Morningstar X-Ray needs a paid Investor plan, with a 7-day trial.
Is Portfolio Visualizer free?
Yes, for personal and educational use, with no login required. The free tier supports portfolios of up to 15 assets, has limited history and leaves out the current month-to-date results. Paid Basic and Pro plans, billed annually, raise those limits.
What is Morningstar X-Ray?
It is Morningstar Investor’s portfolio breakdown. It looks through funds and ETFs and shows asset class, 12 sectors, world regions, fees, style boxes and related statistics, compared with a benchmark you choose. It is of most use when you hold several funds, not only individual stocks.
Do I have to link my broker?
No. Most of these tools also let you add holdings by hand or by file import. Linking saves time and keeps the analysis current. Portfolio Visualizer is designed around holdings you enter yourself and does not replace a live broker link.
Prices at a glance
Prices from each official pricing page. Prices can differ by region and may exclude tax.
Research, not advice. This article explains how tools work. It is general information, not a recommendation to buy or sell any investment, and not personal advice. Investing puts your capital at risk and you can get back less than you put in. Prices and plans change, so check the official site before you pay.
Some links on this page are affiliate links. If you subscribe through them we may earn a commission, at no extra cost to you. We score every tool on the same published criteria, using facts from official pages and our own testing. How we make money. This page is general information, not personal investment advice.