

Our Snowball Analytics verdict
Snowball Analytics is a portfolio tracker built around dividend income. It shows a dividend calendar, forecasts your income for the year ahead and tracks yield on cost, alongside performance including fees and dividends.
You can connect over 1,000 brokers in the US, Europe, the UK and Asia, or import broker reports. The free plan covers 1 portfolio with 10 holdings. Paid plans start at USD 7.99 a month, and there is a 14-day free trial with no card.
It tracks assets on 70+ exchanges in 30+ currencies; we found a Dubai stock priced in dirhams. It is a tracker first, so company research is limited.
Who Snowball Analytics is for, and who it is not for
Good fit if you are
- Dividend investors who want to see future income
- People with several brokers who want one view
- Investors holding stocks in many countries and currencies
Look elsewhere if you are
- People who want to research or rate new stocks
- Anyone with more than 10 holdings who does not want to pay
- Traders who want charts
Snowball Analytics key features
Dividend calendar and forecast
See future dividend payouts for the year ahead, track dates and amounts, and forecast your passive income.
Source: snowball-analytics.comBroker connections
Automatic connections with over 1,000 brokers in the US, Europe, the UK and Asia, plus broker report imports.
Source: snowball-analytics.comPerformance and diversification
Performance including fees, dividends and trades, diversification by sector, class and region, and metrics such as the price to earnings ratio, beta (how much your holdings move with the market) and the Sharpe ratio (return for the risk taken).
Source: snowball-analytics.comBacktests
Test portfolio ideas on historical data, with 30+ years of data.
Source: snowball-analytics.comSnowball Analytics prices
| Plan | Regular price | With our link | Notes |
|---|---|---|---|
| Free | Free | Free | |
| Starter | $79.99a year | $71.99Save 10% first year Code KAI at checkout. | |
| Investor | $149.99a year | $134.99Save 10% first year Code KAI at checkout. | |
| Expert | $249.99a year | $224.99Save 10% first year Code KAI at checkout. |
Snowball Analytics pros and cons
Pros
- Built around dividend income tracking
- Low-cost paid plans and a 14-day trial with no card
- Code KAI gives 10% off the first payment on any paid plan
Cons
- A tracker first, so company research is limited
- Free plan limited to 1 portfolio and 10 holdings
- More portfolios need the Investor plan
Guided tour: how Snowball Analytics looks inside
The same screens as above, in order, as a step-by-step tour. Each step zooms in on one part of the page.
Your portfolio on Snowball Analytics, step by step
We walk through the signed-in dashboard, holdings list, dividend views, diversification and one stock page. Use Next, the step list or your arrow keys. On a phone you can swipe.
-
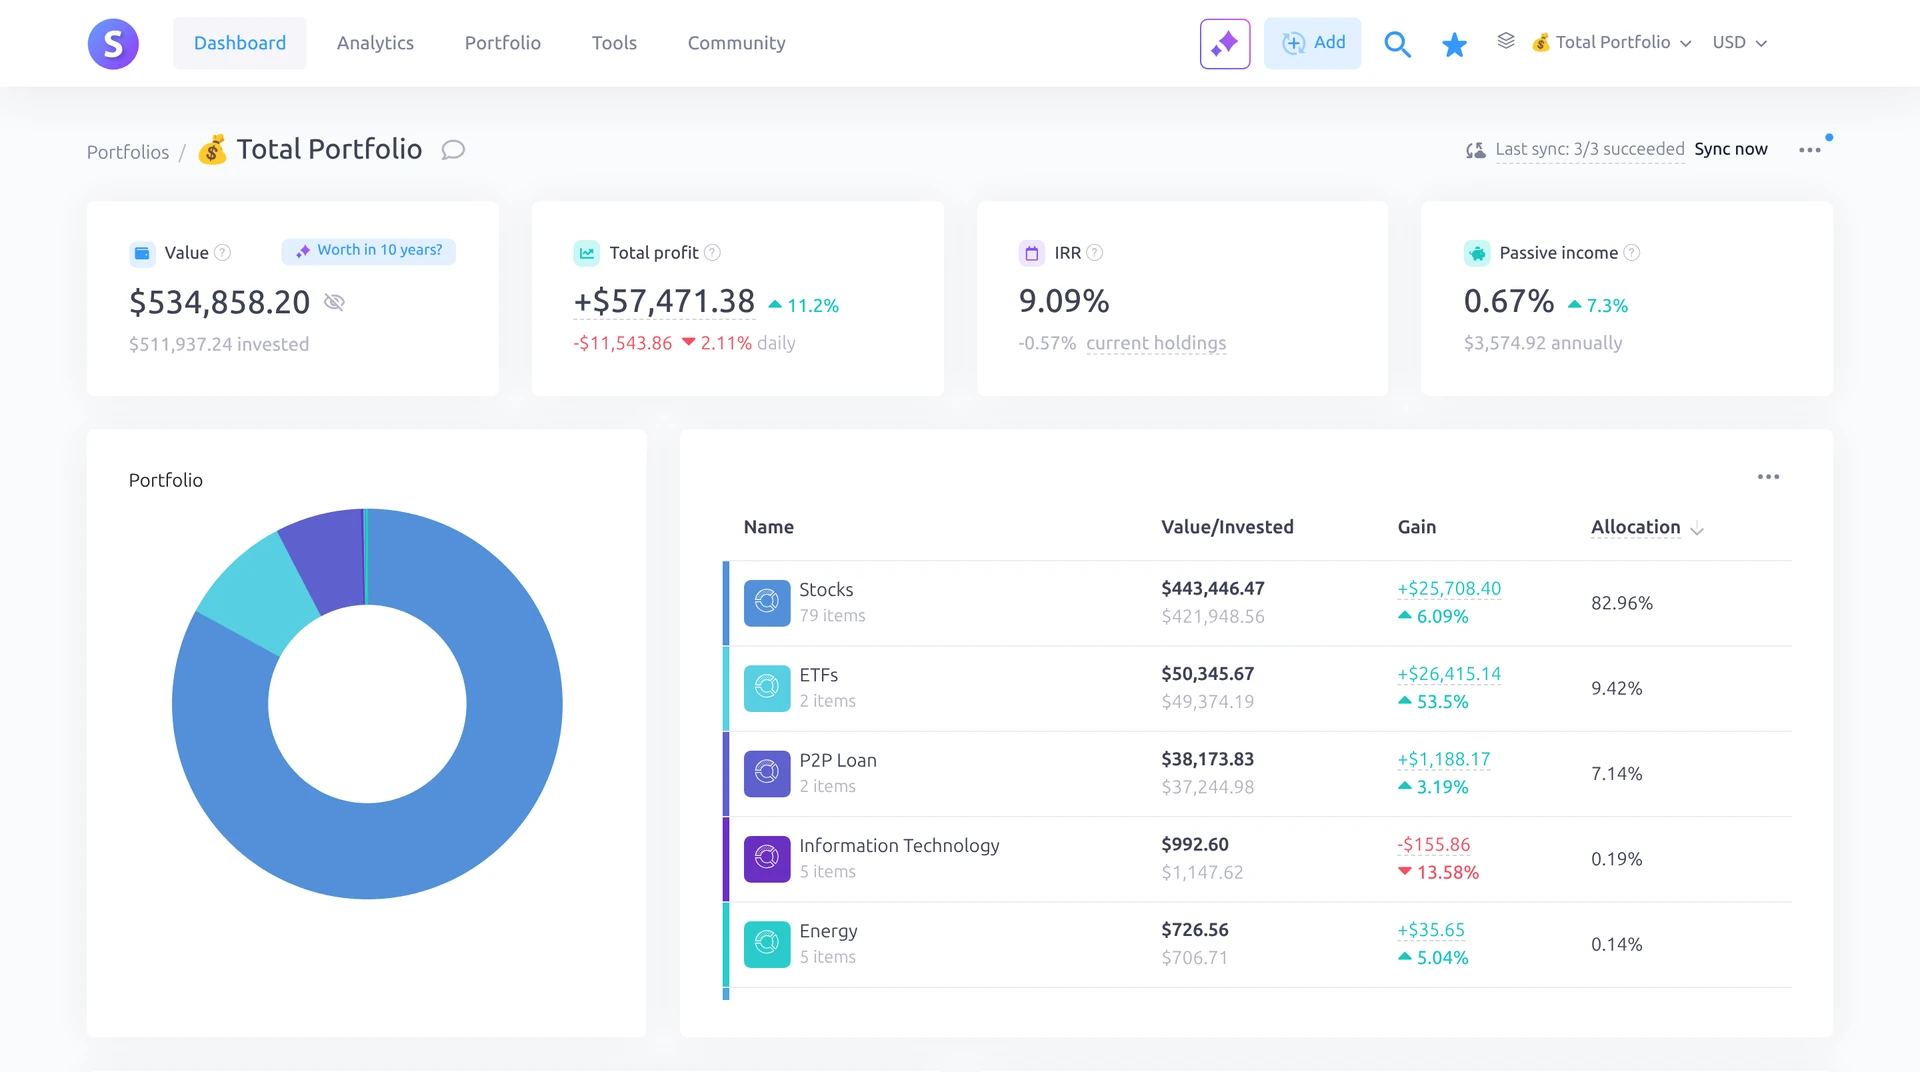
Step 1 of 7Your portfolio at a glanceThe Dashboard opens with four cards: portfolio value, total profit, IRR and passive income yield. The last sync line at the top shows whether your broker connections updated.Open full screenshot -
Step 2 of 7How your money is splitThe donut and the table next to it list each asset class with its value, gain and share of the portfolio. Day gainers and losers sit underneath so you can see what moved today.Open full screenshot -
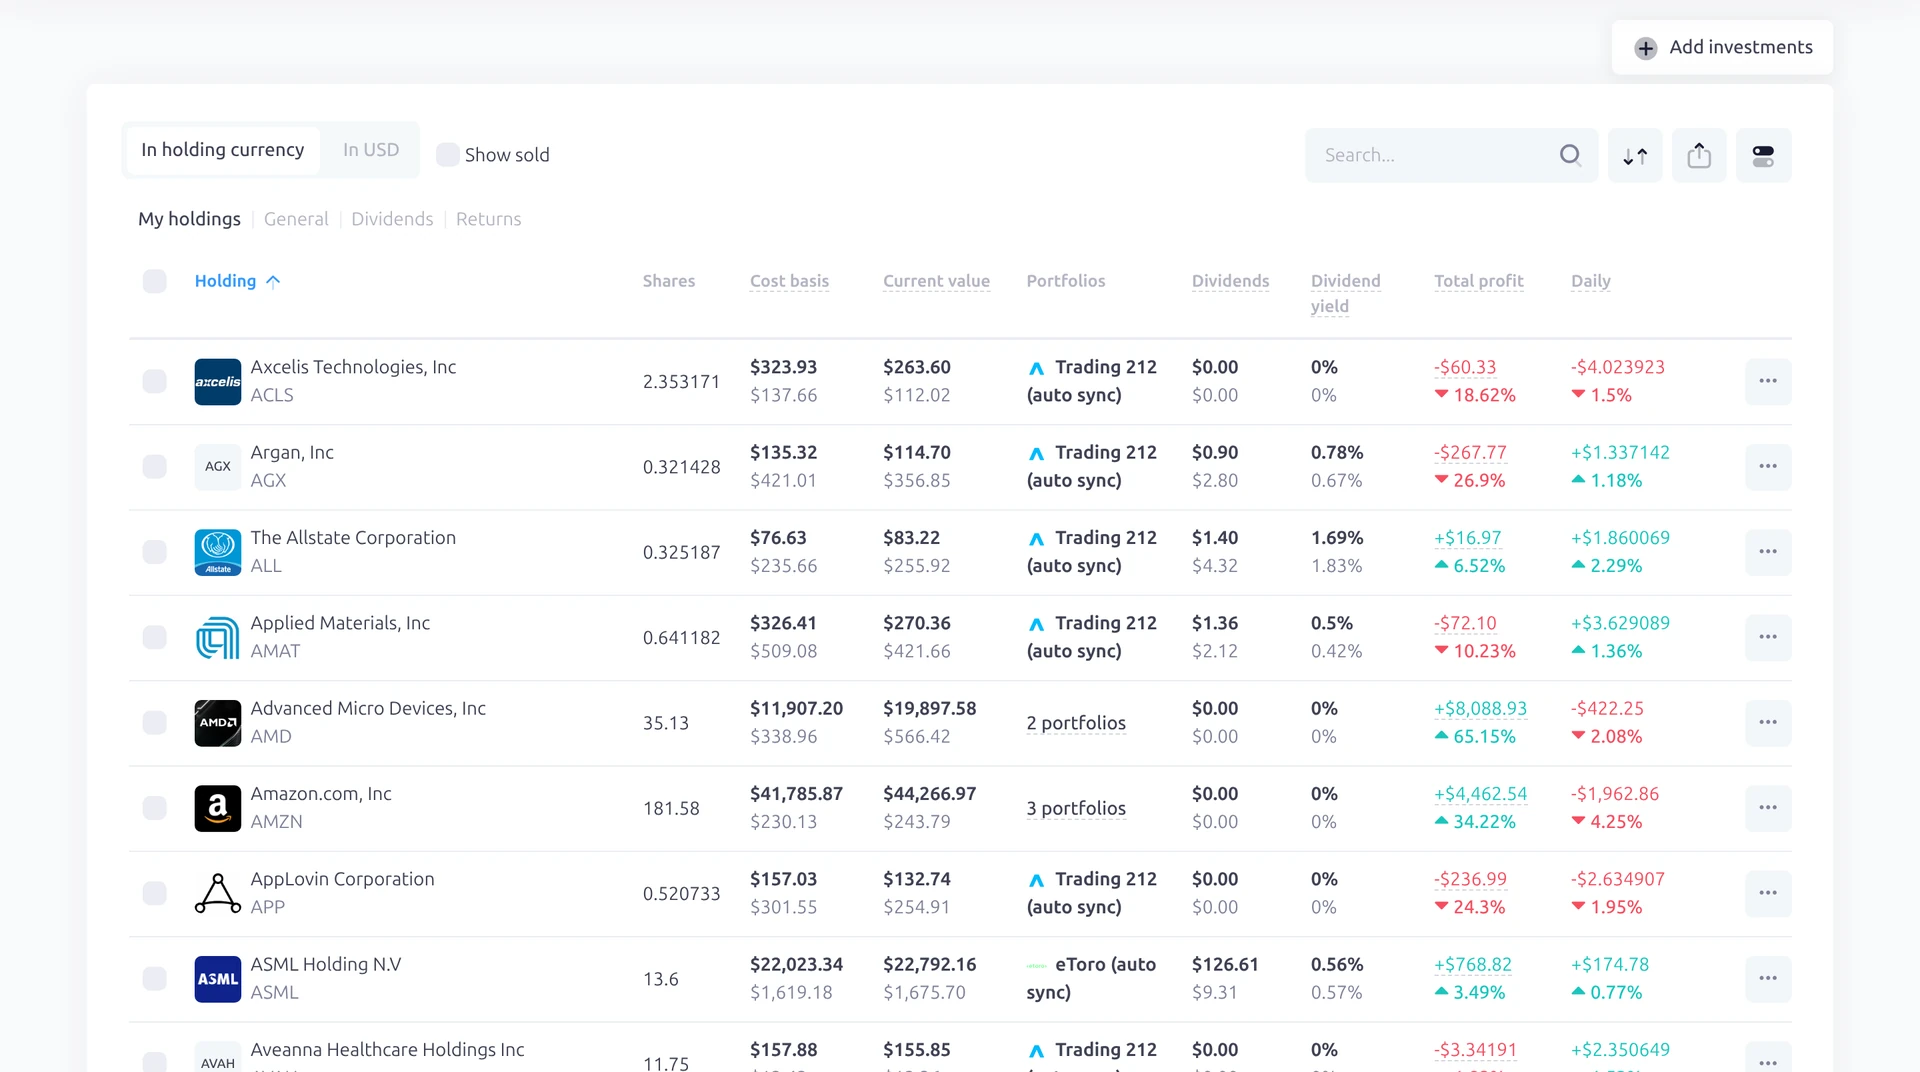
Step 3 of 7Every holding in one tableUnder Portfolio, My holdings lists each position with shares, cost basis, current value, dividends, yield, total profit and the daily change. Broker sync labels such as Trading 212 or etoro appear next to synced rows.Open full screenshot -
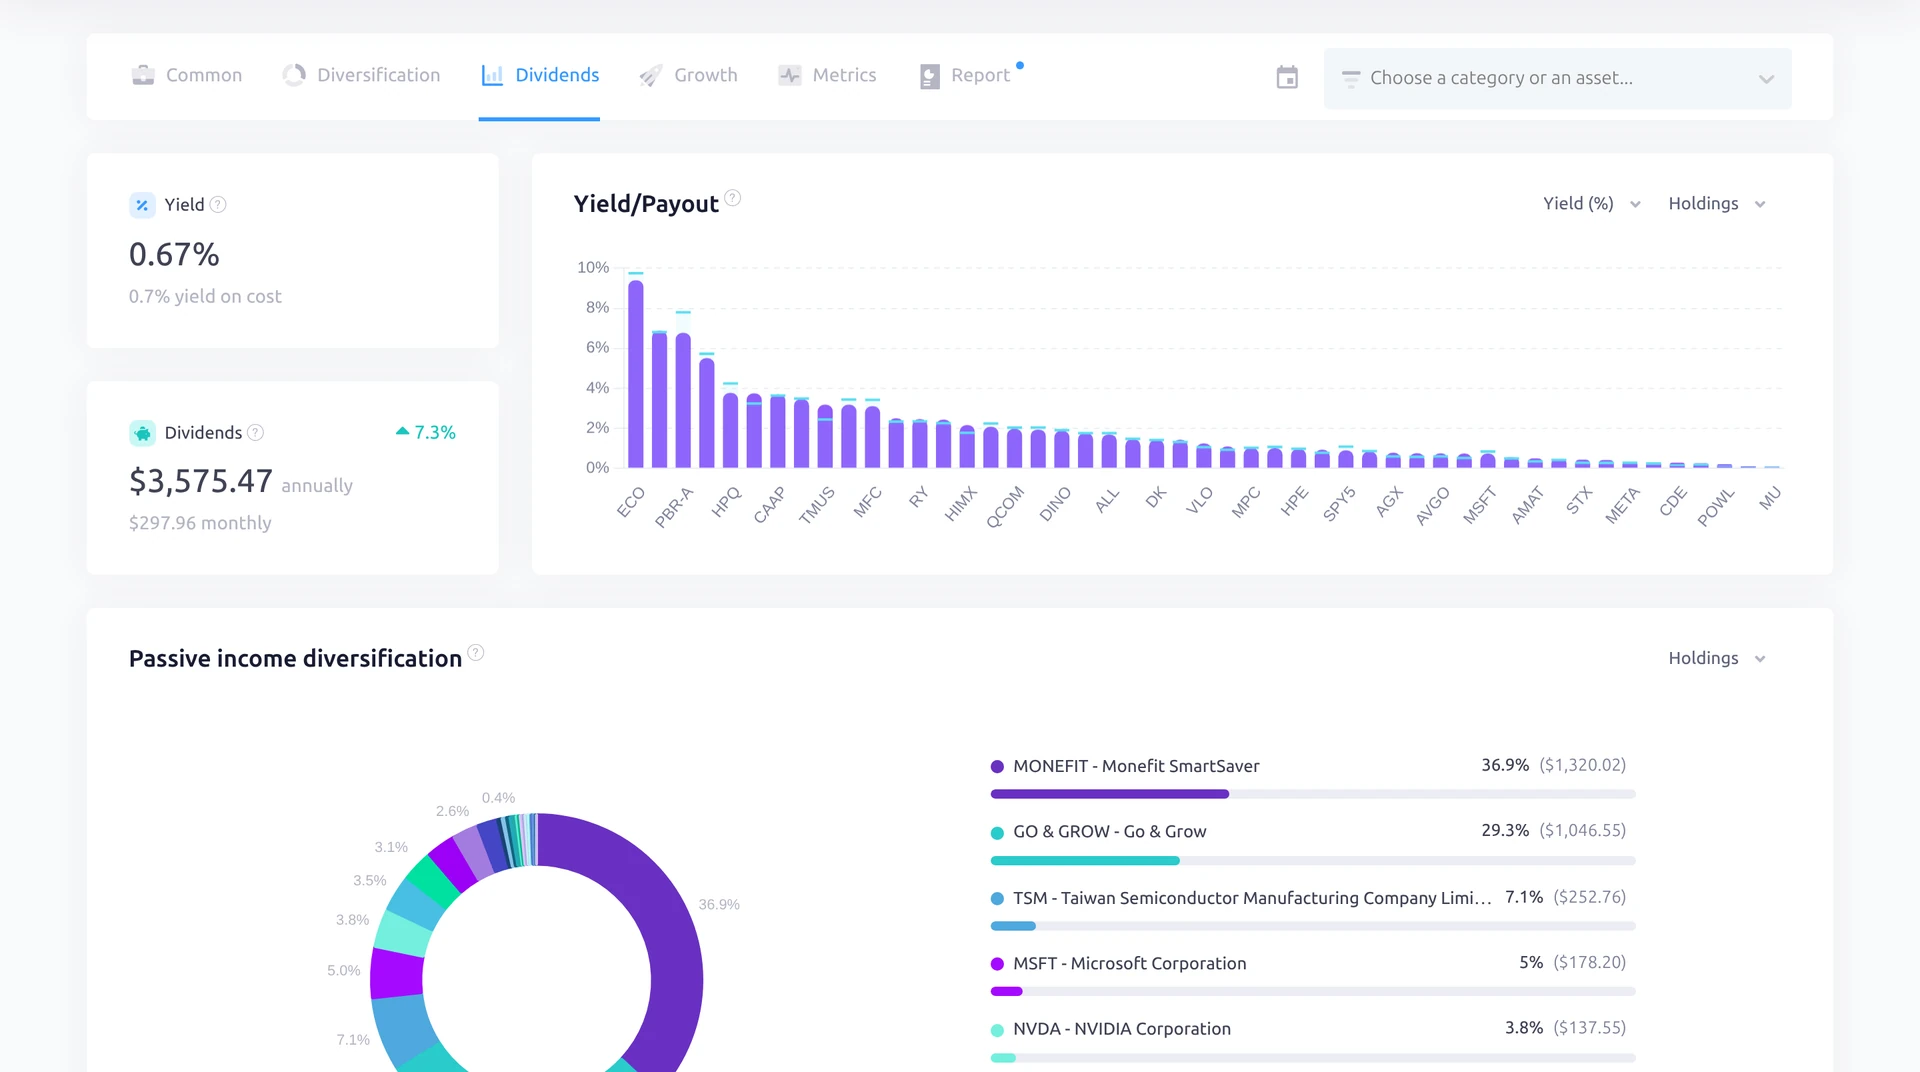
Step 4 of 7Yield and dividend incomeThe Dividends tab under Analytics shows portfolio yield, yield on cost and annual dividend income, with a bar chart of each holding's yield. Passive income diversification below shows which holdings pay the most.Open full screenshot -
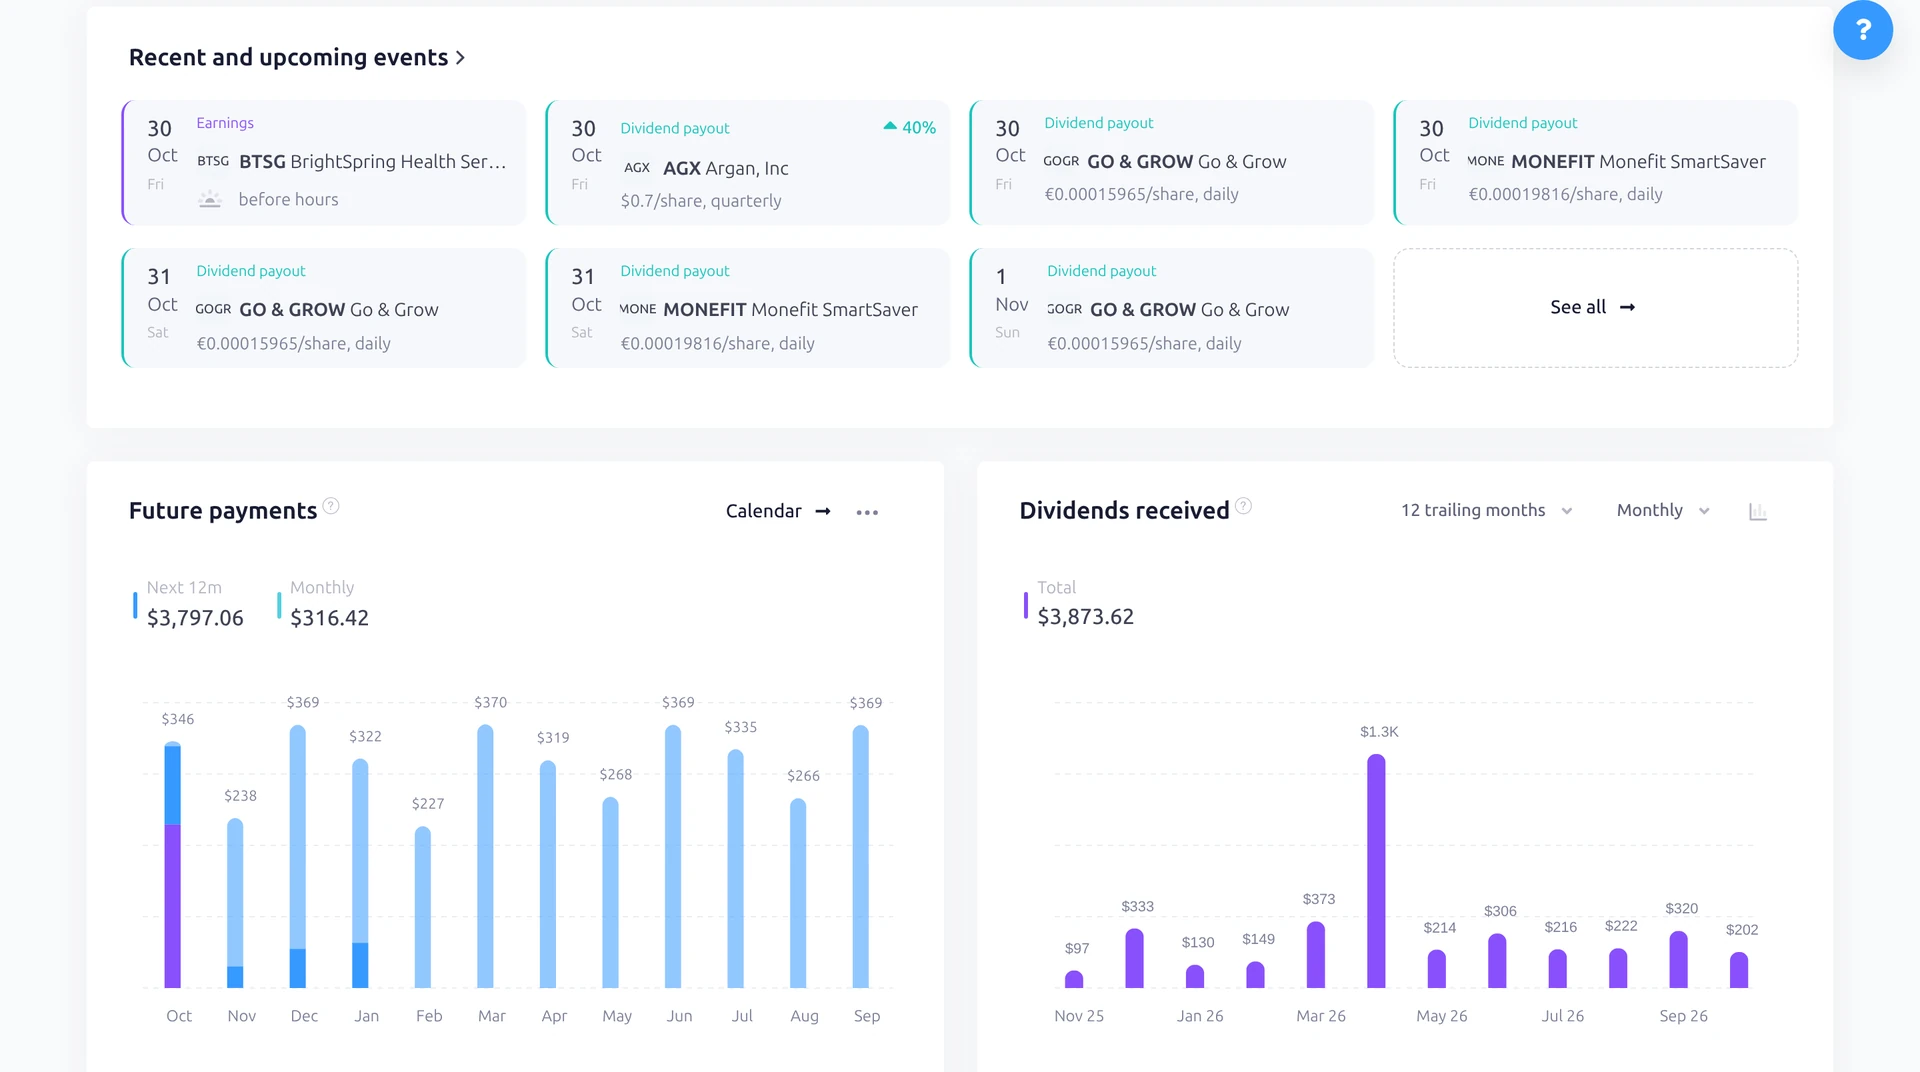
Step 5 of 7Upcoming payouts and dividends receivedUpcoming events list ex-dates and payouts per share. Future payments estimates income month by month for the next 12 months, and Dividends received shows what was paid over the last 12.Open full screenshot -
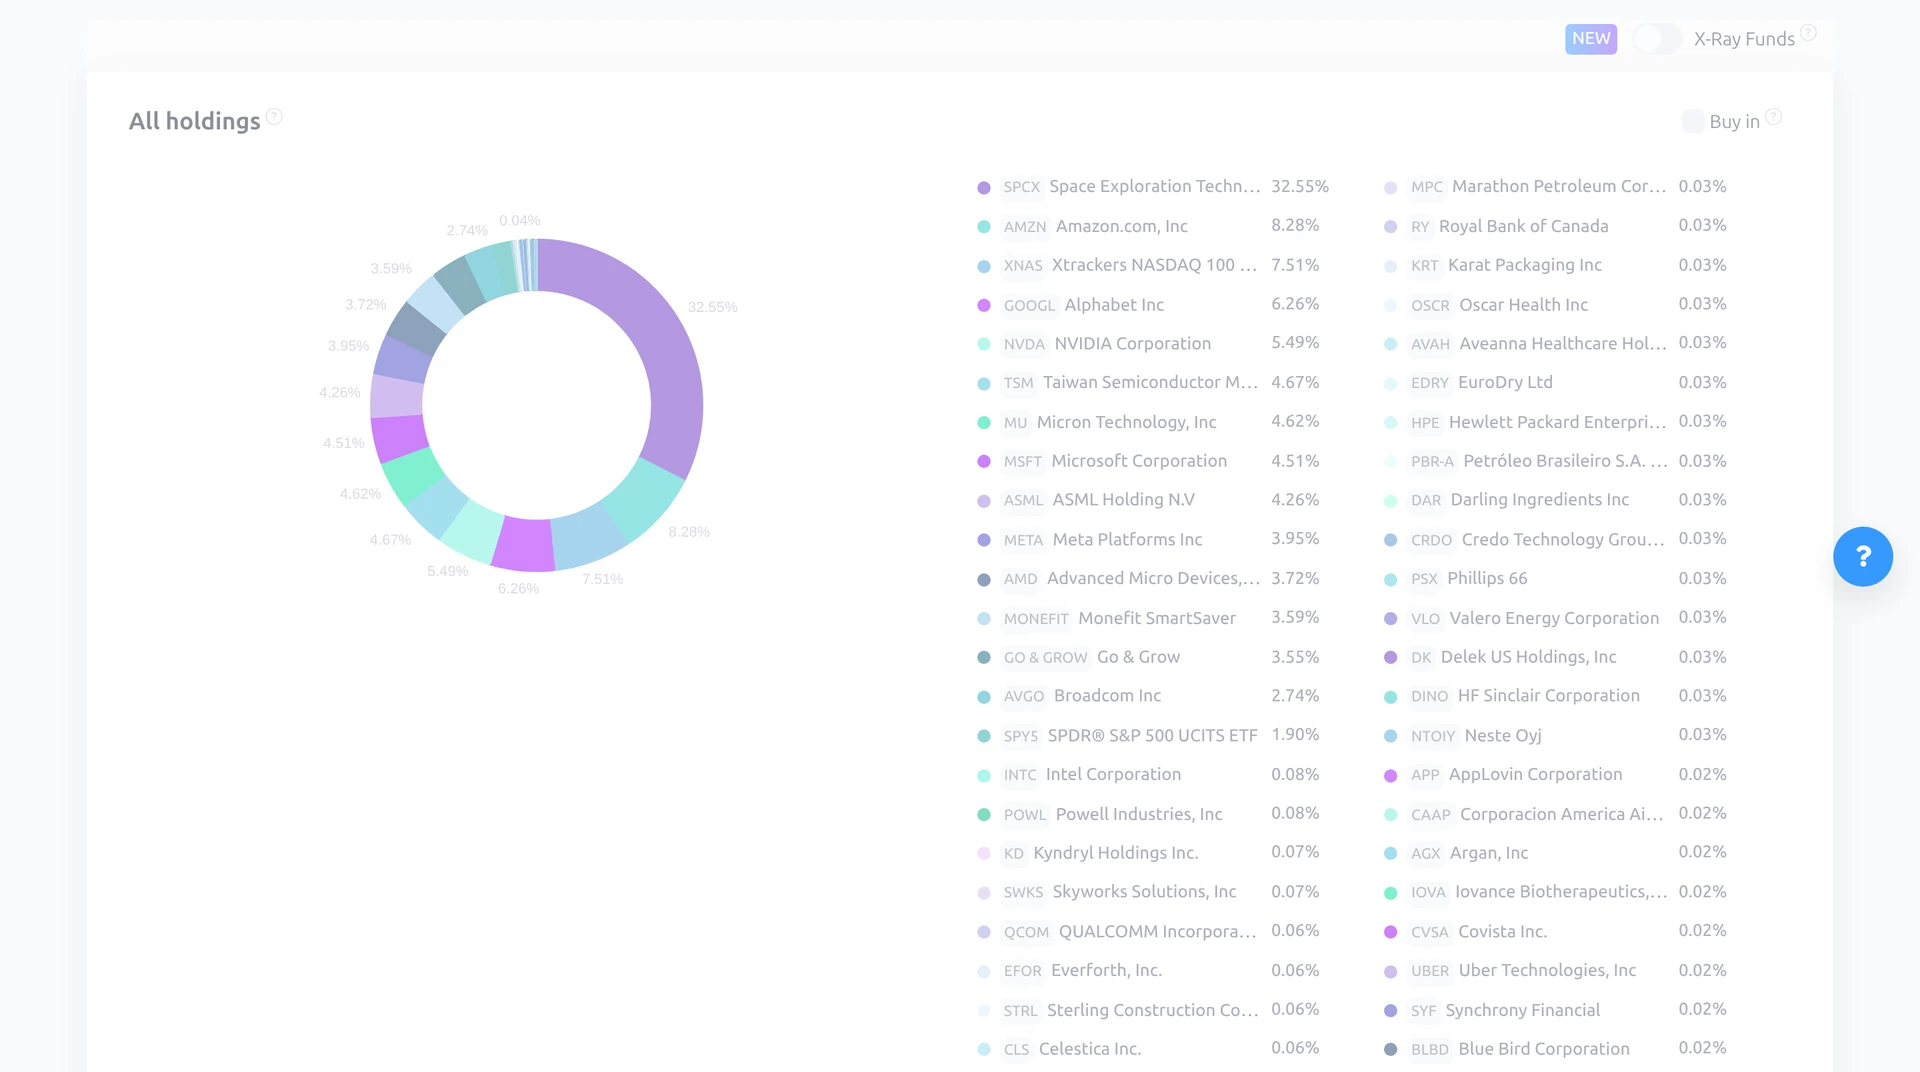
Step 6 of 7How diversified you areThe Diversification tab puts every holding in one donut with its share in percent. Further down you can switch between sectors, asset classes, currencies, regions and countries.Open full screenshot -
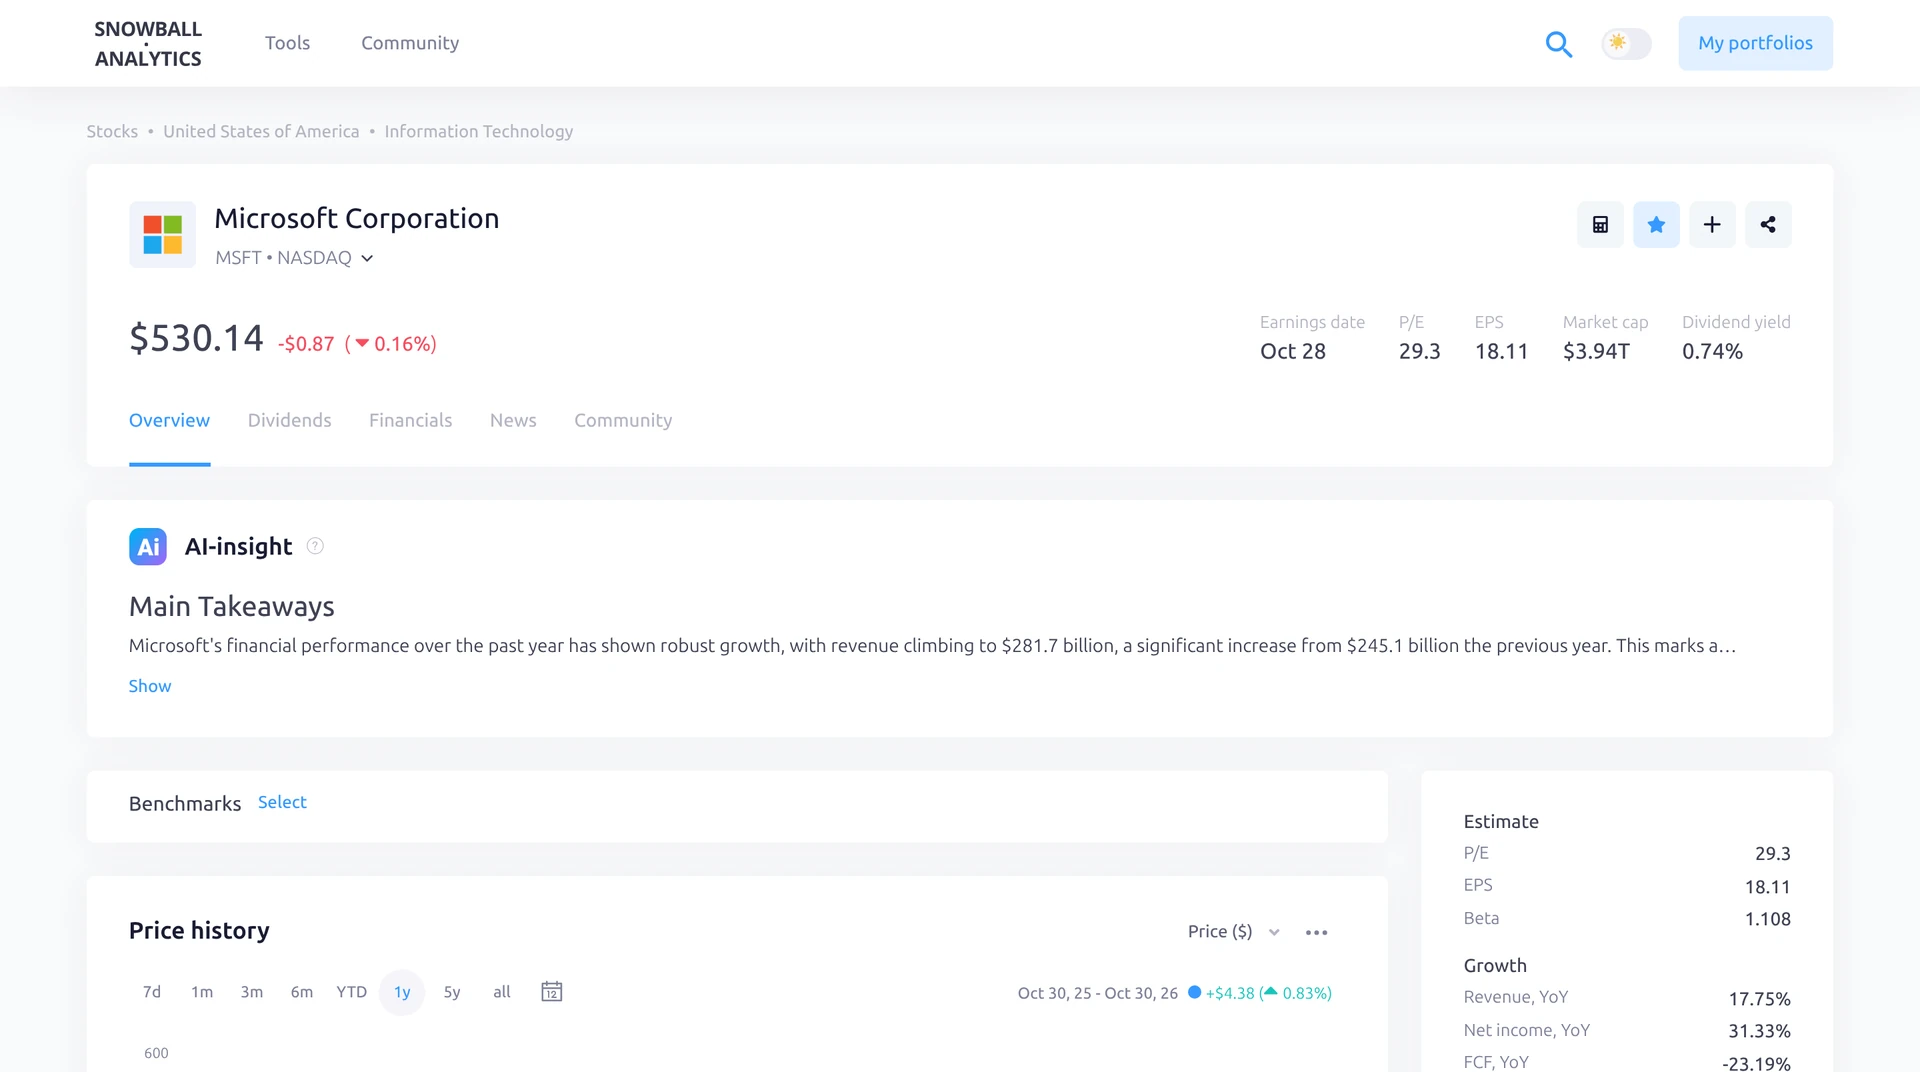
Step 7 of 7One stock in more detailOpening a holding shows that stock's page, here Microsoft as an example, not a recommendation: price and key figures, an AI-insight summary, then the price chart and your own position underneath.Open full screenshot
Screens from Kai's own Snowball Analytics account, captured 30 Oct 2026. Holdings and amounts are from a real portfolio, shown for transparency. Holdings are examples of how the screens look, not recommendations. Figures change every day.
Where Snowball Analytics ranks
We rank tools by job, not overall. Snowball Analytics is ranked in one of our job lists. We score every tool on the same published criteria, using facts from official pages and our own testing. How we score.
Snowball Analytics alternatives



Snowball Analytics FAQ: common questions
Is Snowball Analytics free?
Yes. The free plan has 1 portfolio, 10 holdings, 1 watchlist, a dividend calendar and broker report import.
Is there a Snowball Analytics discount code?
Yes. Code KAI gives 10% off the first payment on any paid plan (for example Starter from $79.99/yr to $71.99/yr). Enter it at checkout after you create a free account, or use our link. Renewals are at the normal price.
How does the free trial work?
You get 14 days of full access without a card, limited to 2 portfolios. After that the account moves to the free plan.
Does it work with UK, EU and UAE stocks?
Yes. It supports 70+ exchanges, including London and European exchanges. We found Emaar on the Dubai exchange, priced in AED.
Some links are affiliate links, so we may earn a commission at no extra cost to you. How we make money. General information, not personal investment advice. Ratings and fair value estimates are model outputs or opinions and can be wrong.