

Our Fiscal.ai verdict
- What it is
- A web research terminal for company financials, segments, earnings calls and filings
- Free plan
- No. Some company pages open without an account
- Paid plans
- Pro $49 a month or $468 a year, Max $99 a month or $948 a year (USD)
- Free trial
- 7 days, card needed at signup
- Markets
- 100,000+ companies, ETFs and funds worldwide
- Works on
- Web browser
Fiscal.ai is a tool for reading a company's numbers yourself. Search a company and every page has the same row of tabs: Overview, Financials, Investor Relations, Research, Estimates, News, Ownership, Industry, Dividends, Modeling and Filings. In my own account, two parts stand out to me: Segments & KPIs, which split revenue by product and region, and the earnings call transcripts, where the AI Summary and Custom Prompt buttons sit right next to the text.
It does not give a buy or sell rating or its own fair value. There is a DCF Modeling tab, but you set the inputs yourself. What you get is clean data: fiscal.ai says it builds its own data for US, Canadian, UK and EU companies and ADRs, checked by human analysts, and updated 3 to 7 minutes after earnings. Other markets come from S&P Capital IQ within 24 to 48 hours. That is why it sits below tools with their own ratings in our lists, while its data goes deeper than most tools in those lists.
There is no free plan. Pro costs $49 a month, or $39 a month billed yearly, and Max costs $99 a month, or $79 a month billed yearly. Both start with a 7-day free trial that needs a card. Max adds longer history, as-reported figures with a click through to the filing, and data export. With our link, code SRH is meant to take 15% off the payments in your first 11 months.
Who Fiscal.ai is for, and who it is not for
Good fit if you are
- Investors who like to read income statements, segments and earnings calls themselves
- People who want revenue split by product, region or company KPI over many years
- Investors who follow companies in the US, the UK or Europe, where fiscal.ai builds its own data
- Anyone who wants AI summaries of earnings calls next to the original transcript
Look elsewhere if you are
- Beginners looking for a simple buy, hold or sell rating
- People who want a free plan to use long term
- Traders who need real-time prices or technical chart tools
- Anyone who needs data export on the cheaper plan (financial data export is on Max)
Fiscal.ai key features
One set of tabs for every company
Type a name or ticker into the search bar at the top ("Search 50,000+ companies" in the app) and the company opens on Overview: a short description, key statistics such as P/E and growth rates, and a price chart. The same tabs sit above every company, so once you know one page you know them all. fiscal.ai says it covers 100,000+ companies, ETFs and funds.
Source: fiscal.aiFinancials you can switch between views
The Financials tab has the Income Statement, Balance Sheet, Cash Flow Statement, Ratios, Segments & KPIs, Adjusted and Custom Metrics. Switches let you pick Annual, Quarterly, Semi-Annual or LTM (last twelve months) and Common Size, which shows each line as a percent of revenue. Pro shows 15 years and 20 quarters; Max shows 20+ years and 40+ quarters and adds the as-reported version next to the standardized one.
Source: fiscal.aiSegments & KPIs
This is where fiscal.ai stands out. It splits revenue the way the company reports it, for example by product and by region, and adds company-specific KPIs. fiscal.ai says it has segment and KPI data for 2,500+ companies: Pro covers 10 years and 15 quarters, Max the full history.
Source: fiscal.aiCharting for financial figures
Charting draws financial figures rather than price candles. You search a metric (the box reads "Search for 20,000+ metrics, segments, & KPIs"), add one or more companies, and switch between annual, quarterly or LTM. Share link and Download let you keep the chart.
Source: fiscal.aiScreener
The Screener filters by country, industry and exchange, then by hundreds of metrics with a minimum and maximum for each. You can also type what you want into the "Apply filters using AI" bar. fiscal.ai lists Custom AI Summaries, which include screening, on both plans.
Source: fiscal.aiEarnings calls with AI Summary and Custom Prompt
Investor Relations lists past events such as earnings calls, with the transcript, slides and audio. AI Summary gives a summary of the call, and Custom Prompt lets you ask your own question, with Templates for common ones. Pro covers 10 events (calls, transcripts and slides) and limited Investor Relations content; Max covers 30+.
Source: fiscal.aiResearch, estimates and modeling
Both plans include Equity Research with Morningstar reports and AI-generated reports, analyst estimates, estimate revisions, price targets and analyst ratings. Estimates go 2 years and 4 quarters ahead on Pro and 3 years and 5 quarters on Max. The Modeling tab has DCF Modeling, where you set the assumptions yourself. Estimates and models are forecasts and can be wrong.
Source: fiscal.aiFilings
The Filings tab lists a company's official documents with filters for Annual & Quarterly Reports, News, Prospectuses and Registrations, Ownership, Proxy Statements and Other. On Max, Click-thru Audit links figures back to the filing they came from.
Source: fiscal.aiDashboard, notifications and brokerages
The Dashboard is a watchlist table where you choose the columns, such as market cap and P/E. Add your share counts and it shows portfolio statistics. The bell icon gives notifications for news, press releases and filings of companies you follow. Connect brokerage links accounts through an integration partner; the list includes Interactive Brokers, Fidelity, Schwab, Robinhood, Trading212, Degiro, AJ Bell and etoro, and some are in beta.
Source: fiscal.aiFiscal.ai Pro vs Max: what each plan includes
There are two plans for individual investors, Pro and Max. Prices are in USD as shown on fiscal.ai's checkout page on 2 Nov 2026. Paying yearly saves up to 20%. The API and MCP connectors are a separate subscription.
| Feature | Pro | Max |
|---|---|---|
| Price, billed monthly | $49 a month | $99 a month |
| Price, billed yearly | $39 a month ($468 a year) | $79 a month ($948 a year) |
| Free trial | 7 days, card needed | 7 days, card needed |
| Companies, ETFs and funds | 100,000+ | 100,000+ |
| Financial statements history | 15 years, 20 quarters | 20+ years, 40+ quarters |
| Segments & KPIs history | 10 years, 15 quarters | Full history |
| Analyst estimates | 2 years, 4 quarters ahead | 3 years, 5 quarters ahead |
| Adjusted (non-GAAP) figures | 3 years, 5 quarters | 5 years, 20 quarters |
| Events (calls, transcripts, slides) | 10 | 30+ |
| News and Investor Relations | Limited | |
| As-reported financials and Click-thru Audit to the filing | ||
| Export financial data | ||
| Equity Research (Morningstar and AI), AI Summaries, Custom AI Summaries | ||
| Screener, DCF Modeling, Query, notifications, connected brokerages | ||
| Dashboards and rows | 10 dashboards, 100 rows | More (see note) |
Monthly plans are not refunded. Yearly plans can be refunded if you ask within 30 days of buying or renewing. Under the terms, consumers in the EU, the EEA and the UK can also cancel within 14 days for a pro-rated refund.
Fiscal.ai prices
Our dealCode SRH, first 11 months
| Plan | Billed monthly | Billed yearly | Notes |
|---|---|---|---|
| Pro | $49.00 | $468.00$39.00 a month | USD 39 a month billed yearly. 15 years and 20 quarters of financials, 10 years of segment and KPI data, 10 dashboards, 2 years of analyst estimates, equity research (Morningstar and AI), screener, DCF modeling and connected brokerages |
| Max | $99.00 | $948.00$79.00 a month | USD 79 a month billed yearly. Everything in Pro plus 20+ years and 40+ quarters of financials, 15+ years of segment and KPI data, as-reported financials, a click-through audit to the filing, and data export |
How to get started with Fiscal.ai
Signing up takes a few minutes. There is no password: fiscal.ai sends a login link to your email.
- Pick a plan
Open the plans page, choose Pro or Max, and choose monthly or yearly billing. Yearly costs less per month.
- Start the 7-day trial
A card is needed to start the trial. It turns into the paid plan when the 7 days end unless you cancel first.
- Add code SRH
Code SRH is meant to give 15% off the payments in your first 11 months. Check that the lower price shows at checkout before you pay.
- Open a company you know
Search for a company in the bar at the top. Start with Overview, then Financials and Segments & KPIs, so you see how the tabs fit together.
- Build a Dashboard
Add the companies you follow and the columns you care about. Connect a brokerage if you want your holdings in it, or type in share counts.
- Decide before the trial ends
Cancel before day 7 if you do not want to keep it. Monthly payments are not refunded later.
Sources: fiscal.ai Help Center, Terms of Service and affiliate page, checked 2 Nov 2026.
Fiscal.ai pros and cons
Pros
- Segments & KPIs show revenue by product, region and company KPI
- Own data for US, UK and EU companies, updated minutes after earnings
- Earnings call transcripts with AI Summary and Custom Prompt side by side
- The same clear tabs on every company page
- Morningstar and AI research reports included on both plans
- Connects to many brokerages, including Interactive Brokers, Trading212 and etoro
Cons
- No free plan, and the trial needs a card
- No own rating or fair value to sum up a stock
- Financial data export and as-reported figures only on Max
- Monthly plans are not refunded
- Prices 15 minutes delayed, end of day outside its own-data markets
- Dense tables and terms such as LTM and EV/EBITDA take some learning
Fiscal.ai vs Koyfin and Stock Analysis
Koyfin and Stock Analysis are the closest tools we review. All three focus on data rather than ratings. Stock Analysis lists Fiscal AI as one of its data providers.
| Feature | Fiscal.ai | Koyfin | Stock Analysis |
|---|---|---|---|
| Free plan | No | Yes, with 2 years of financials | Yes, with limits |
| First paid plan | Pro $49 a month or $468 a year | Plus $49 a month or $468 a year | Pro $9.99 a month or $79 a year |
| Trial or refund | 7-day trial with a card; yearly refundable within 30 days | 7-day trial in the app; 30-day refund guarantee | 60-day money-back guarantee |
| Stands out for | Segments & KPIs, earnings calls with AI summaries | Dashboards and charts across many markets | Long financial history at a low price |
In short, Fiscal.ai goes furthest on segment data and earnings calls. Koyfin has a real free plan and broader charts. Stock Analysis is the cheapest way to get long financial history. For ratings and written analysis, see Seeking Alpha instead.
Where does Fiscal.ai get its data?
This is what fiscal.ai states on its official pages, checked 2 Nov 2026.
Own data in the US, Canada, the UK and the EU
For US, Canadian, ADR, UK and EU companies, fiscal.ai builds the fundamentals itself from filings and investor relations material, with human analyst verification. It says figures update 3 to 7 minutes after earnings and prices are 15 minutes delayed.
Source: fiscal.aiS&P Capital IQ for other markets
Other countries come from S&P Capital IQ, with updates within 24 to 48 hours and end-of-day prices.
Source: fiscal.aiSecurity
fiscal.ai says it is SOC 2 Type II certified, an outside audit of how a company protects data. Brokerage connections run through an integration partner.
Source: fiscal.aiWho is behind it
The site is run by Stratosphere Technology Inc. It also sells a data feed API and MCP connectors to other platforms.
Source: fiscal.aiGuided tour: how Fiscal.ai looks inside
The same screens as above, in order, as a step-by-step tour. Each step zooms in on one part of the page.
Researching one company on Fiscal.ai, step by step
We follow one company, Apple (AAPL), from its Overview to the financials, segments, a chart, an earnings call and its filings, then look at the Screener. Use Next, the step list or your arrow keys. On a phone you can swipe.
-
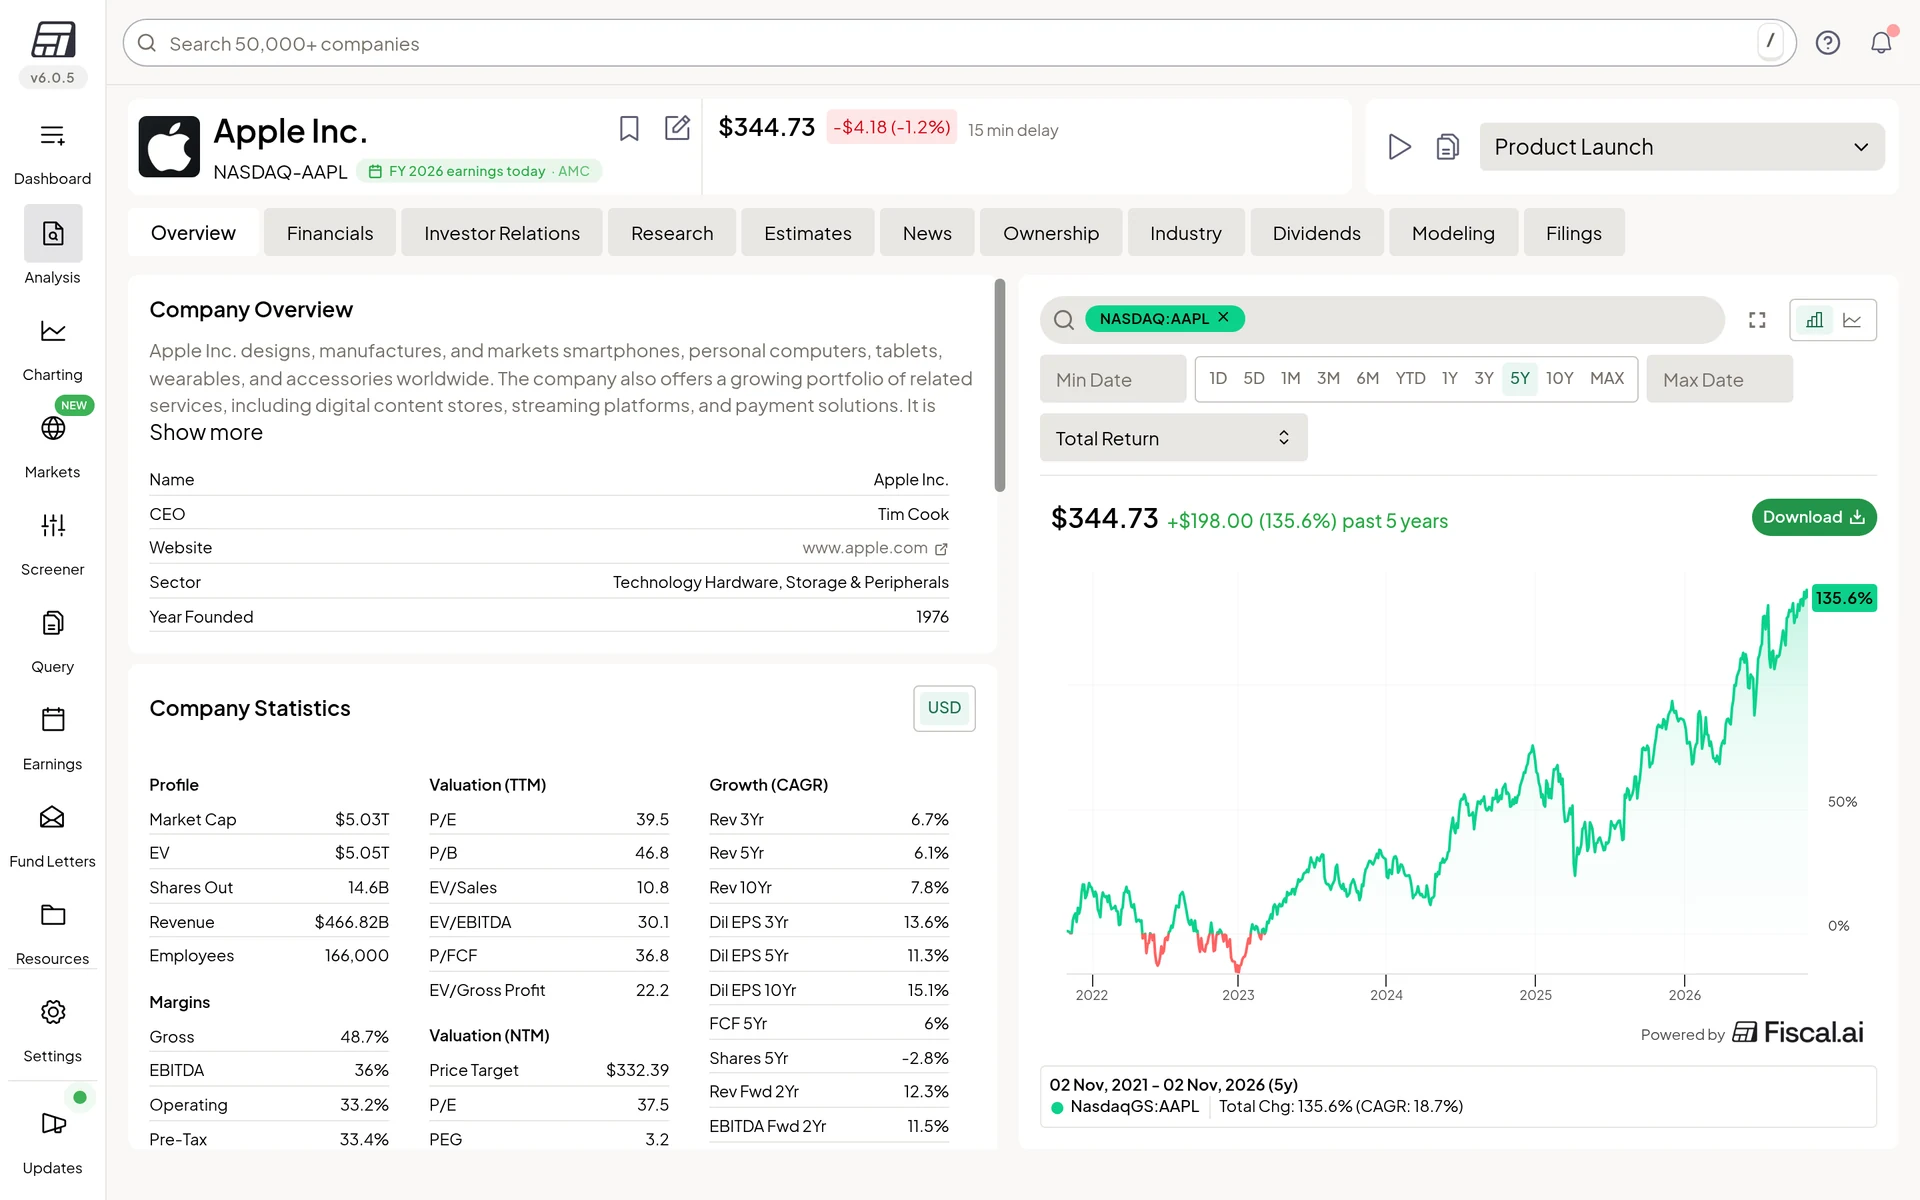
Step 1 of 10The same tabs on every companySearch a company in the bar at the top and its page opens on Overview. The tabs underneath are the same for every company, so you always know where to find the financials, earnings calls or filings.Open full screenshot -
Step 2 of 10Key statistics at a glanceCompany Statistics groups the main figures: size, margins, valuation ratios such as P/E, and growth rates over 3, 5 and 10 years. TTM means the last twelve months.Open full screenshot -
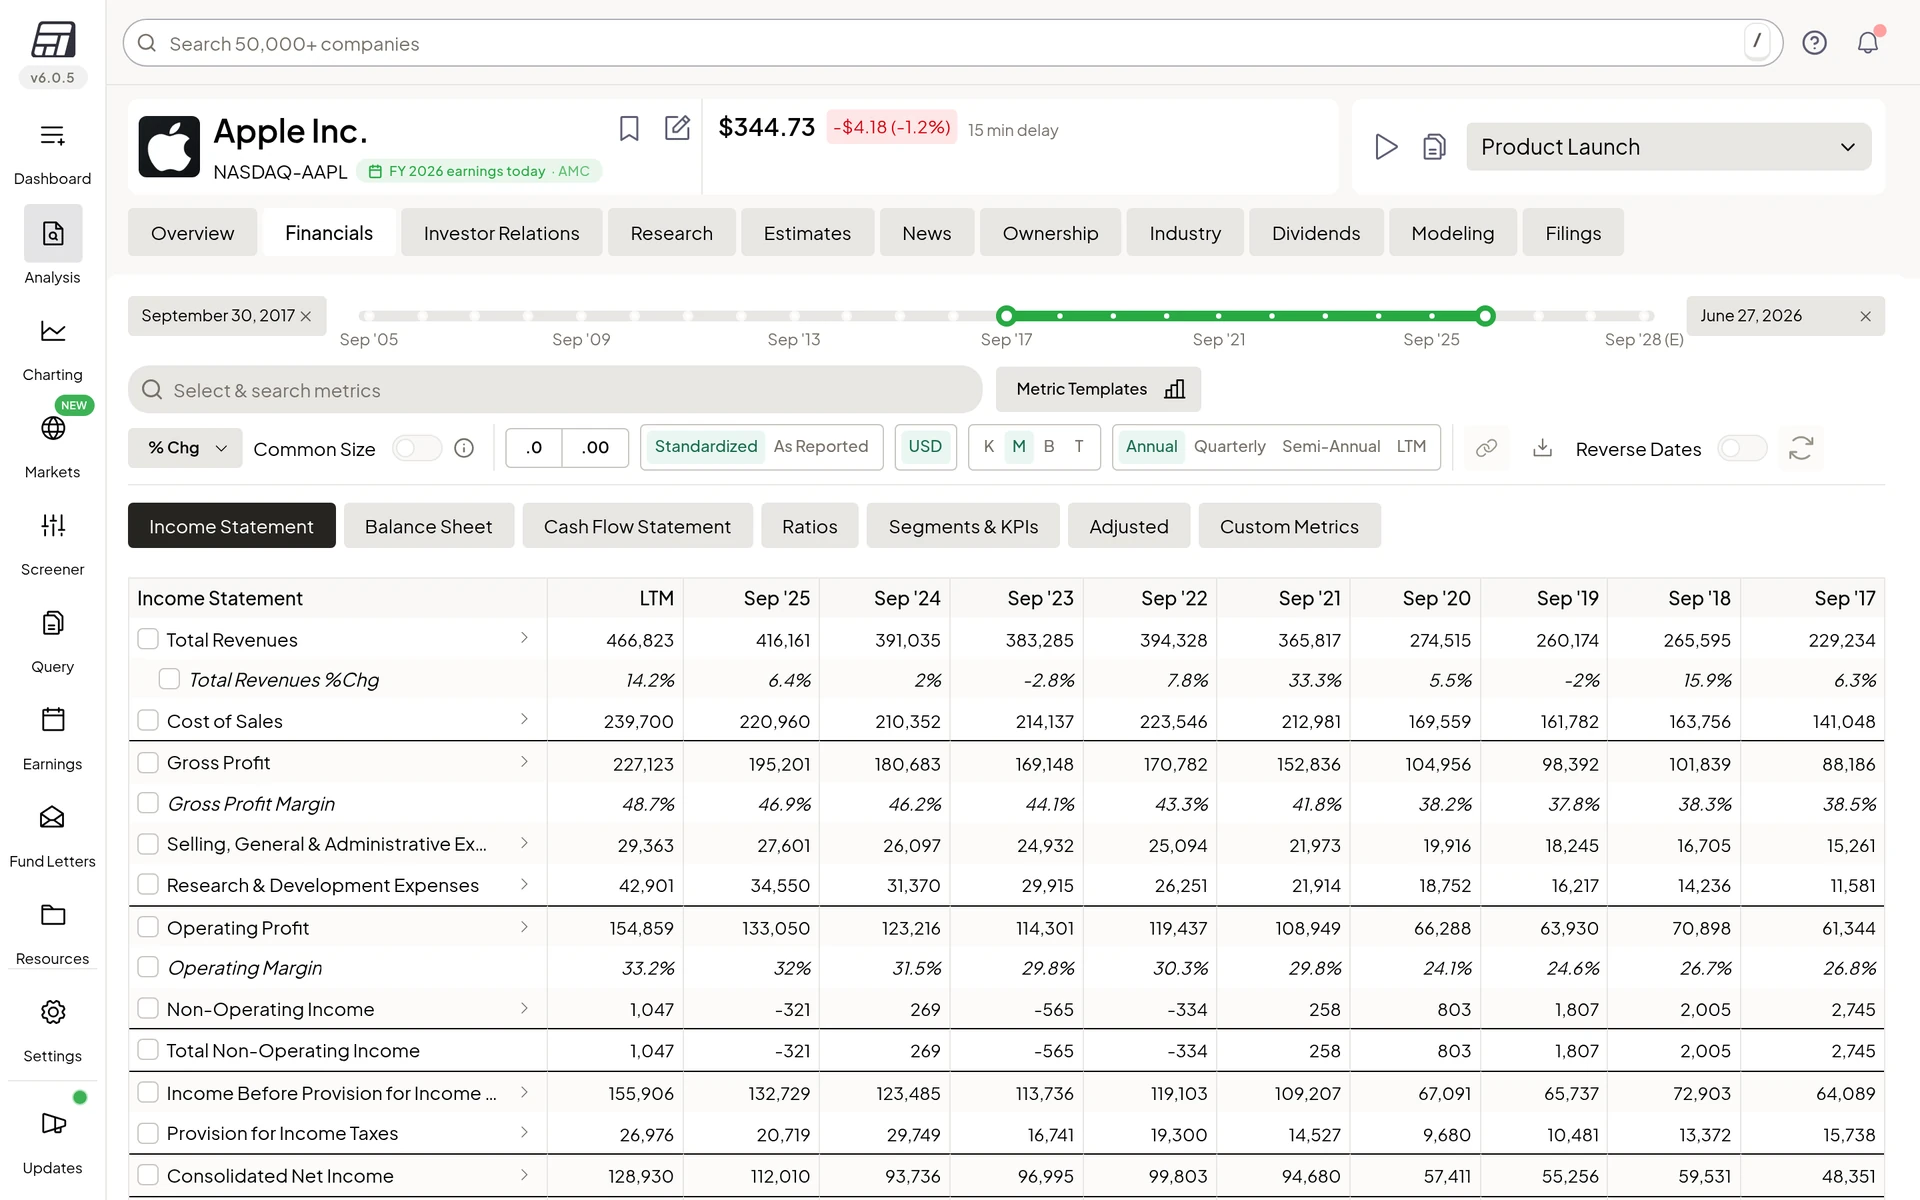
Step 3 of 10Choose how to read the financialsOn Financials, the slider sets the years, and switches choose annual, quarterly or LTM figures and Common Size. The sub-tabs lead to the balance sheet, cash flow, ratios, segments and adjusted figures.Open full screenshot -
Step 4 of 10The income statement, year by yearEach row is one line of the income statement and each column one year, with margins in italics. Pro shows 15 years and 20 quarters; Max goes further back.Open full screenshot -
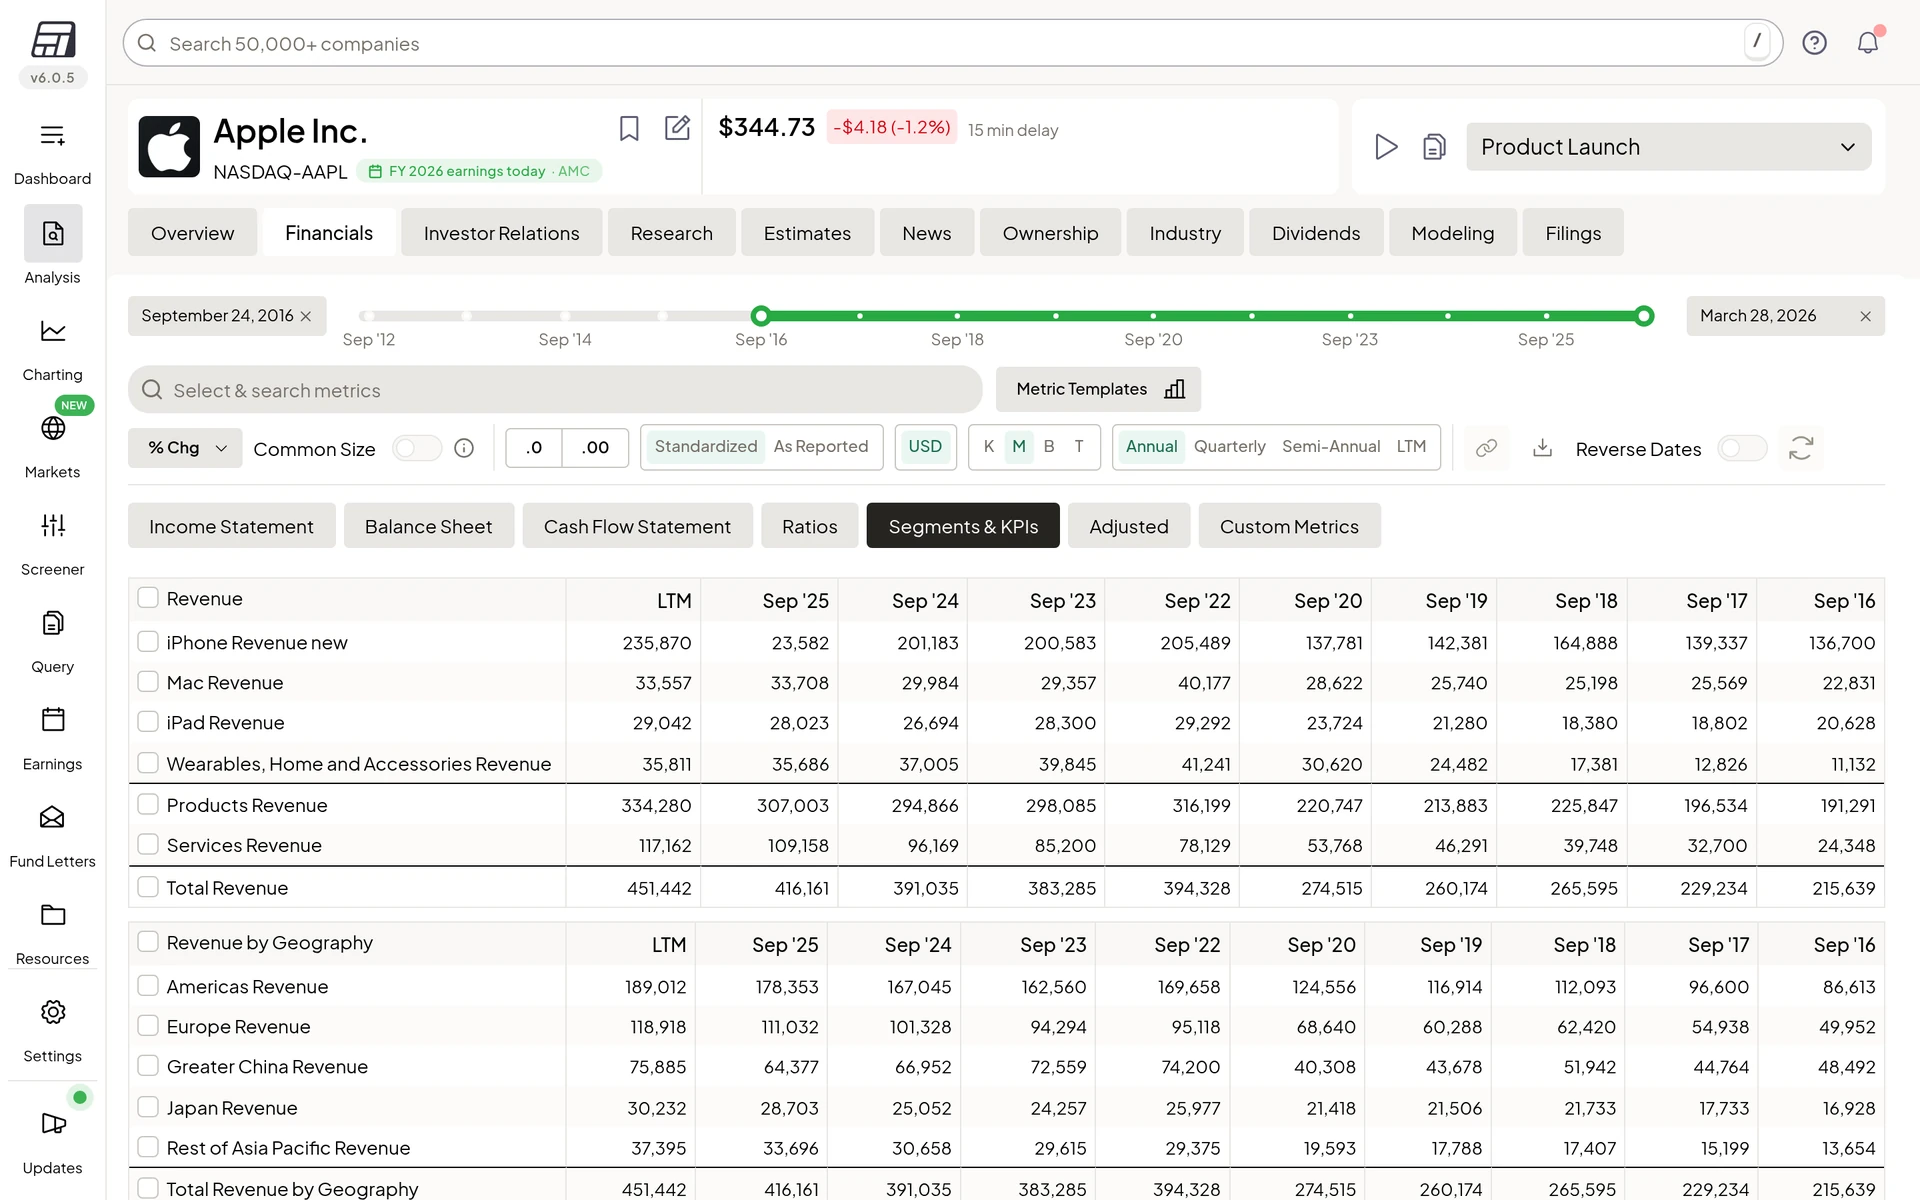
Step 5 of 10Revenue by product and regionSegments & KPIs splits revenue the way the company reports it. Here you can see which products and which regions the sales come from, and how that changed over the years.Open full screenshot -
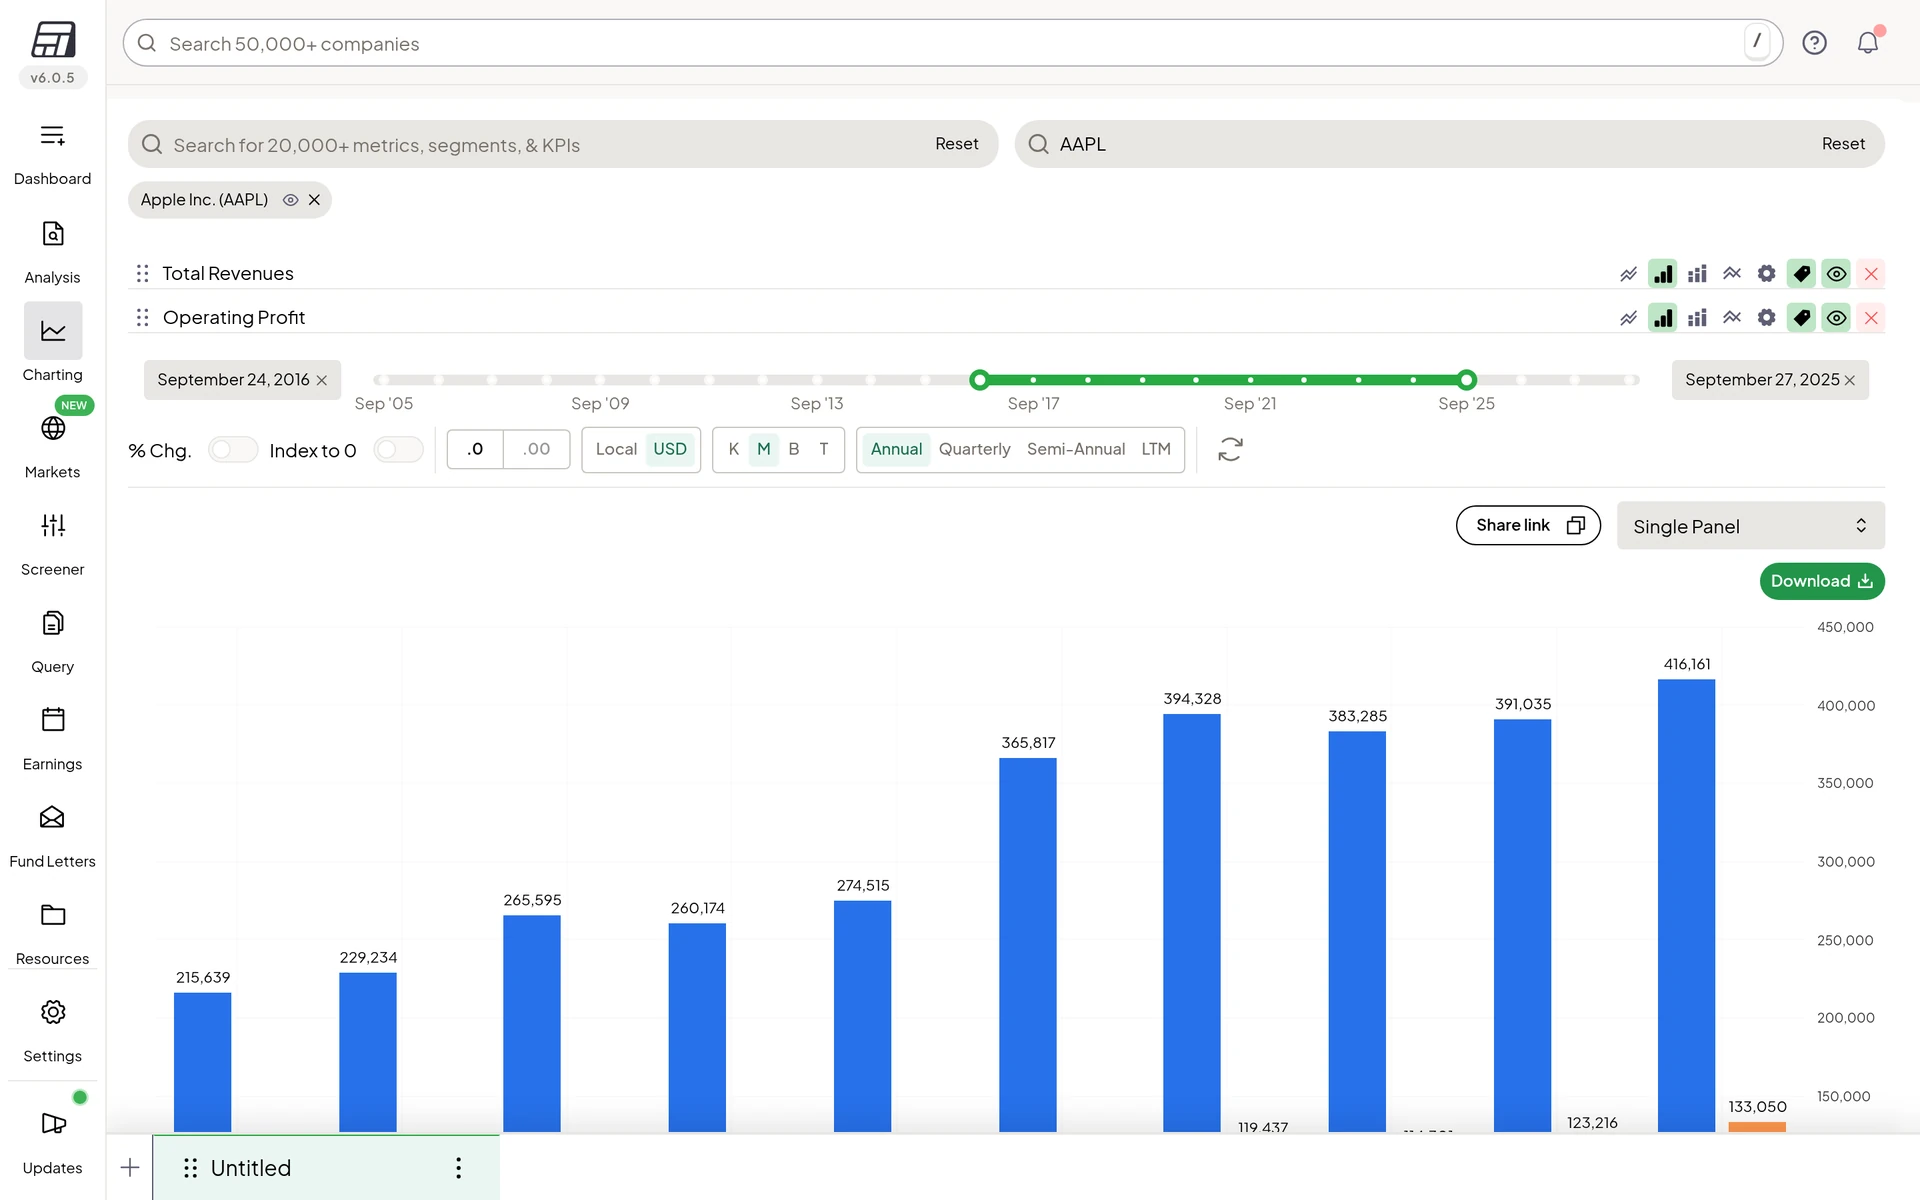
Step 6 of 10Chart the figures, not just the priceCharting turns any figure into a chart. Search a metric, add one or more companies, and use Share link or Download to keep it.Open full screenshot -
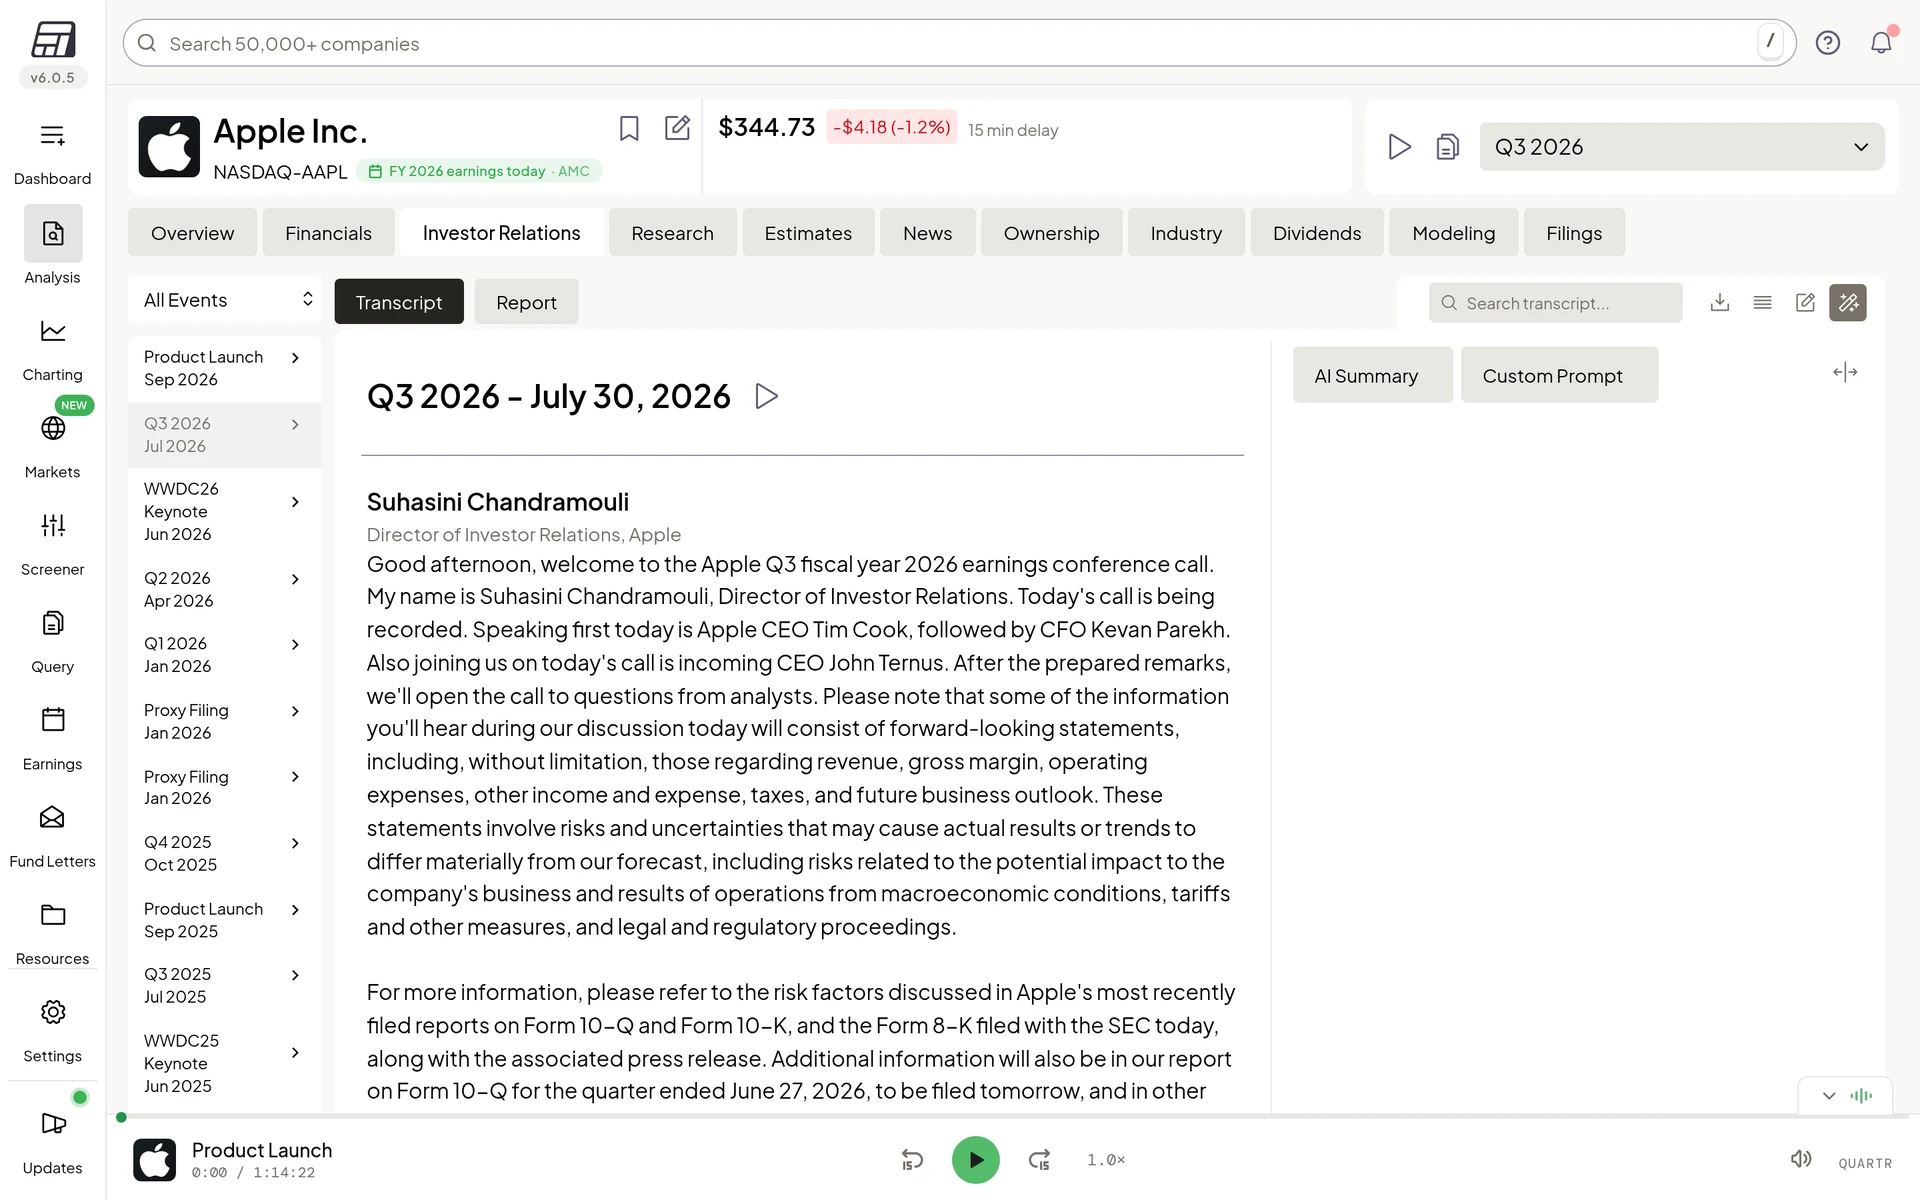
Step 7 of 10Read an earnings callInvestor Relations lists past events such as earnings calls. Click one to read the transcript, open the slides, or play the audio at the bottom.Open full screenshot -
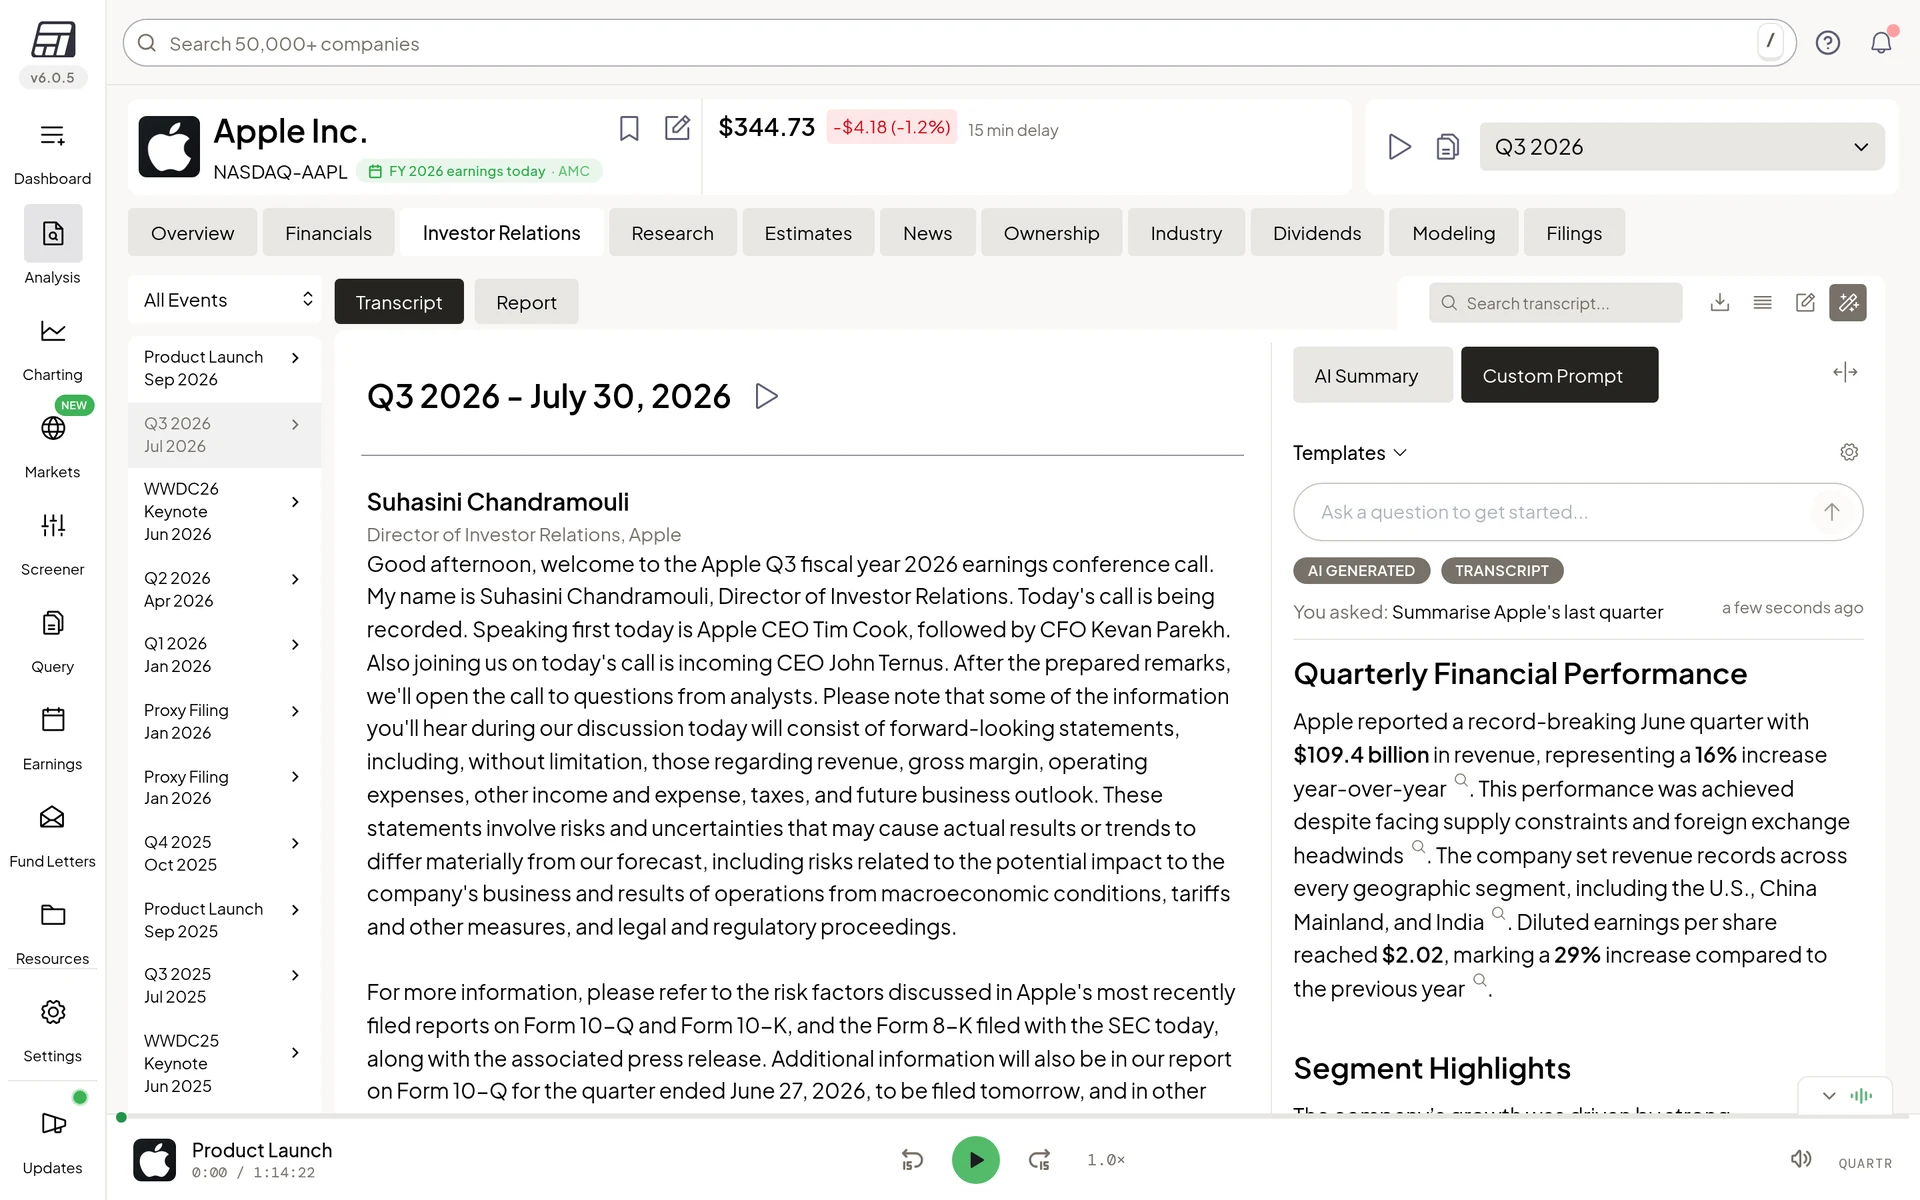
Step 8 of 10Ask the AI about the callAI Summary sums up the call, and Custom Prompt answers your own question, here a summary of the last quarter. Answers are marked AI generated, so check key numbers in the transcript.Open full screenshot -
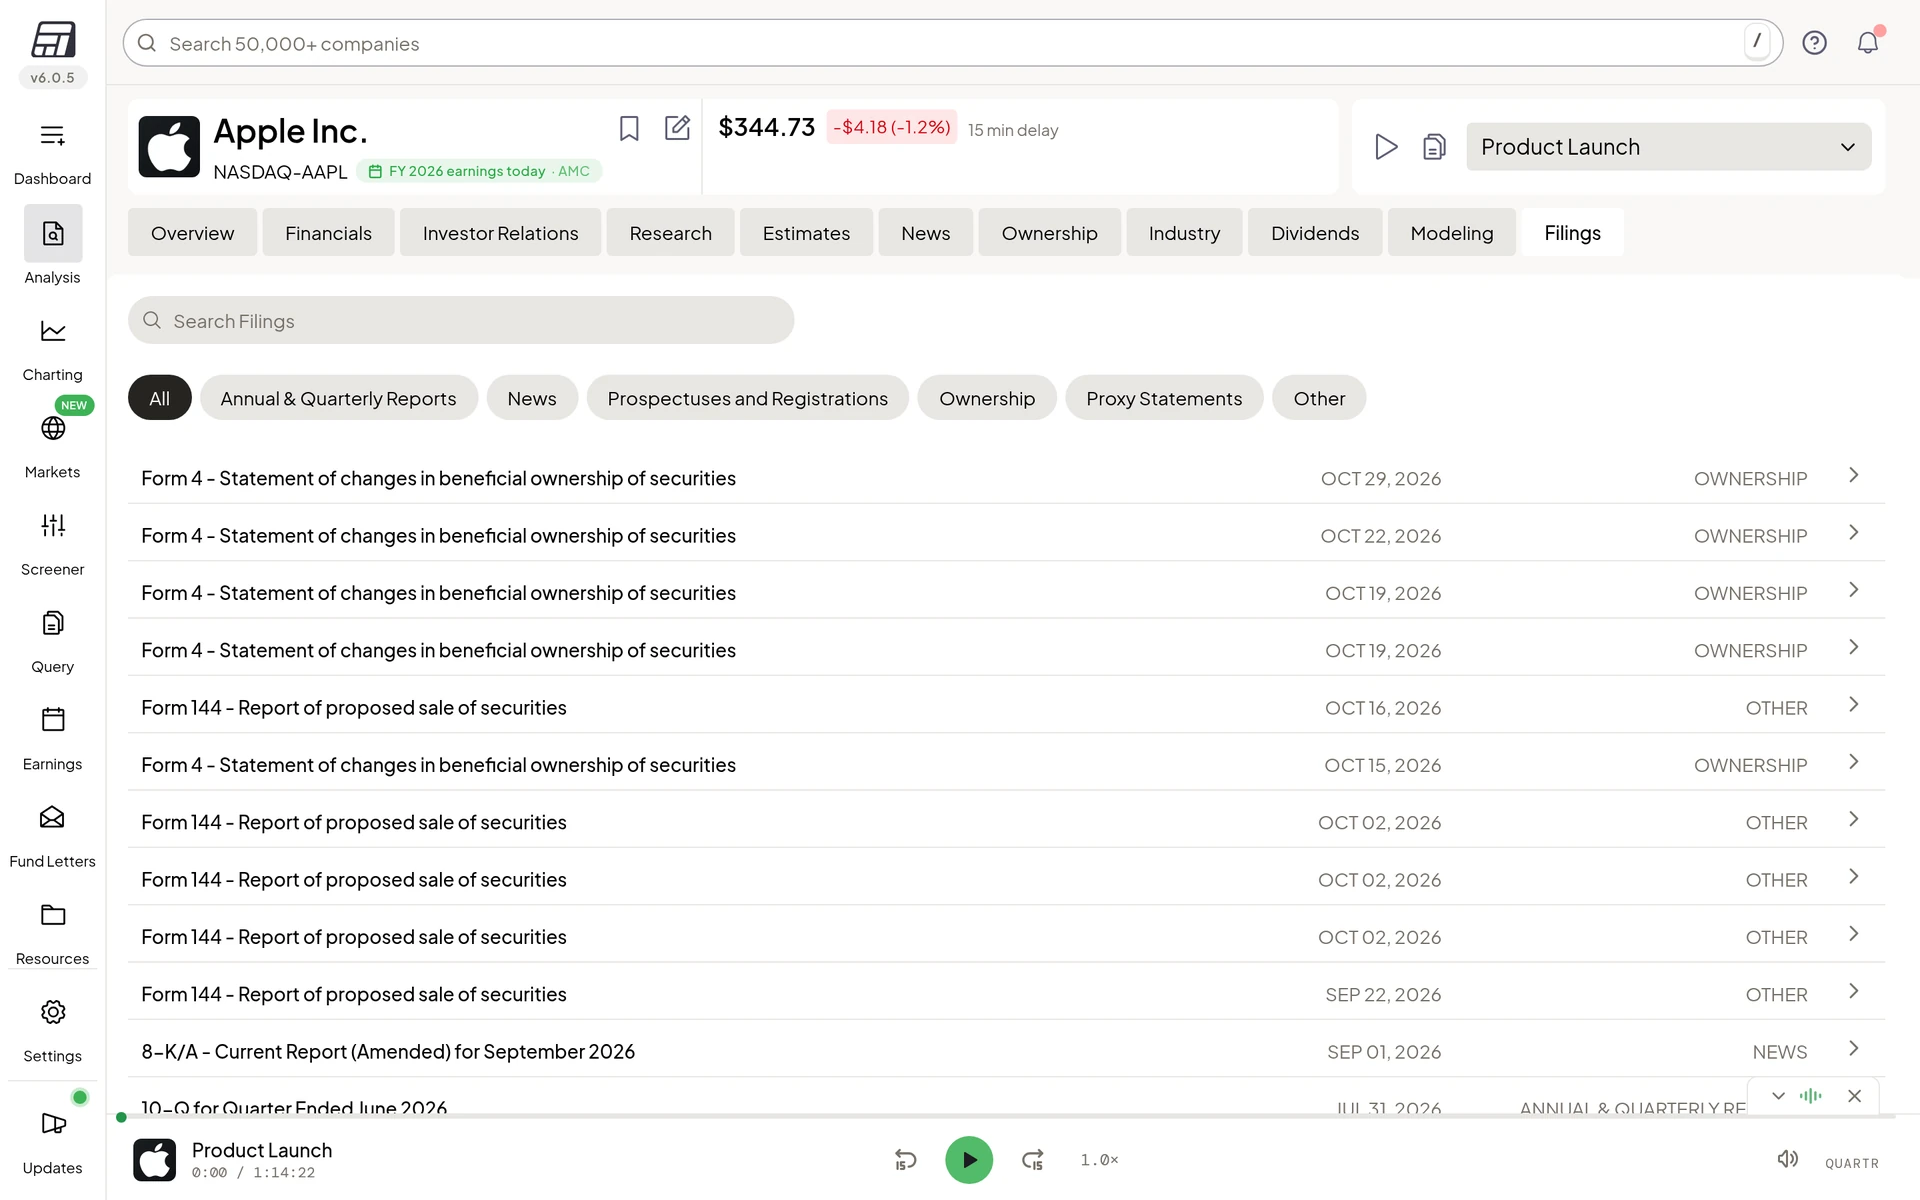
Step 9 of 10Official filings in one listFilings lists the company's official documents with filters by type, such as annual and quarterly reports or ownership forms.Open full screenshot -
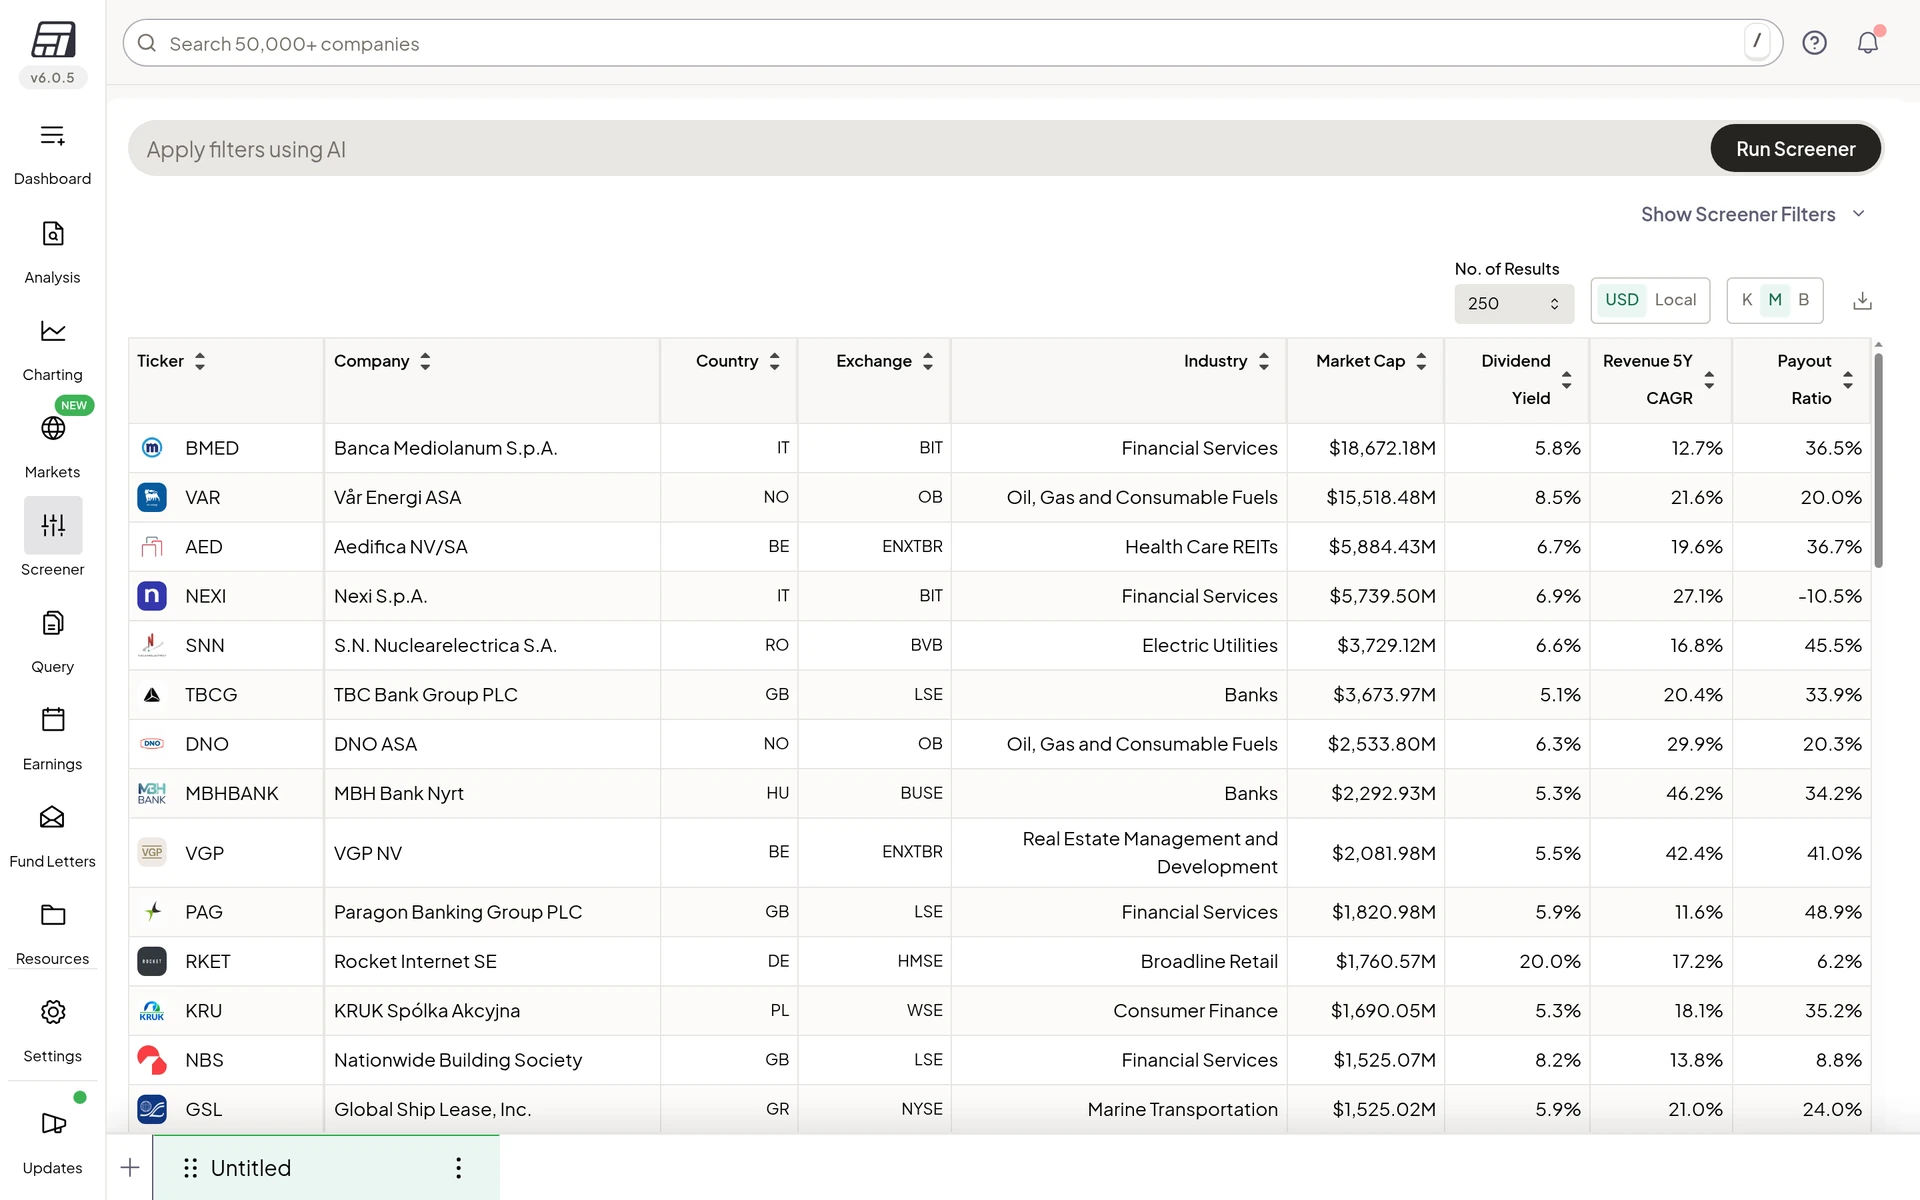
Step 10 of 10Find companies with the ScreenerThe Screener filters by country, industry, exchange and hundreds of metrics. You can also type what you want into the AI bar and run it. The results are a list to research further, not picks.Open full screenshot
Screens from Kai's own Fiscal.ai account, captured 2 Nov 2026. Apple and the companies in the Screener are only examples of how the pages look, not recommendations. Figures and prices change every day.
How Fiscal.ai ranks for each job
We rank tools by job, not overall. Fiscal.ai is ranked in 2 of our job lists. We score every tool on the same published criteria, using facts from official pages and our own testing. How we score.
Fiscal.ai alternatives




Fiscal.ai FAQ: common questions
Is Fiscal.ai free?
No. There is no free plan. Some company pages open without an account, and both paid plans start with a 7-day free trial that needs a card.
How much does Fiscal.ai cost?
Pro is $49 a month, or $39 a month billed yearly ($468 a year). Max is $99 a month, or $79 a month billed yearly ($948 a year). Prices are in USD as shown on fiscal.ai's checkout page on 2 Nov 2026.
Is there a Fiscal.ai discount code?
Code SRH is meant to give 15% off the payments in your first 11 months, then the regular price applies. Check that the discount shows at checkout before you pay.
Can I get a refund?
Yearly plans can be refunded if you ask within 30 days of buying or renewing. Monthly plans are not refunded. Consumers in the EU, the EEA and the UK can also cancel within 14 days for a pro-rated refund under the terms.
Does Fiscal.ai cover UK and European stocks?
Yes. fiscal.ai builds its own data for UK and EU companies as well as US and Canadian ones. Other markets come from S&P Capital IQ, with updates within 24 to 48 hours.
Does Fiscal.ai give buy or sell ratings?
Not its own. It shows analyst ratings, price targets and Morningstar reports, plus AI-generated reports. None of these is advice for you, and forecasts can be wrong.
Can I export data from Fiscal.ai?
Every user can export tables from the Dashboard. Exporting financial data is part of Max, for US, Canadian, ADR, UK and EU companies. There is no Excel add-in.
Does Fiscal.ai connect to my broker?
Yes. Connect brokerage on the Dashboard works through an integration partner. The supported list includes Interactive Brokers, Fidelity, Schwab, Robinhood, Trading212, Degiro, AJ Bell and etoro. Interactive Brokers data can be up to 1 business day behind.
Some links are affiliate links, so we may earn a commission at no extra cost to you. How we make money. General information, not personal investment advice. Ratings and fair value estimates are model outputs or opinions and can be wrong.